Following a small gap-up opening, the major indices continue lower to test the September 30 low

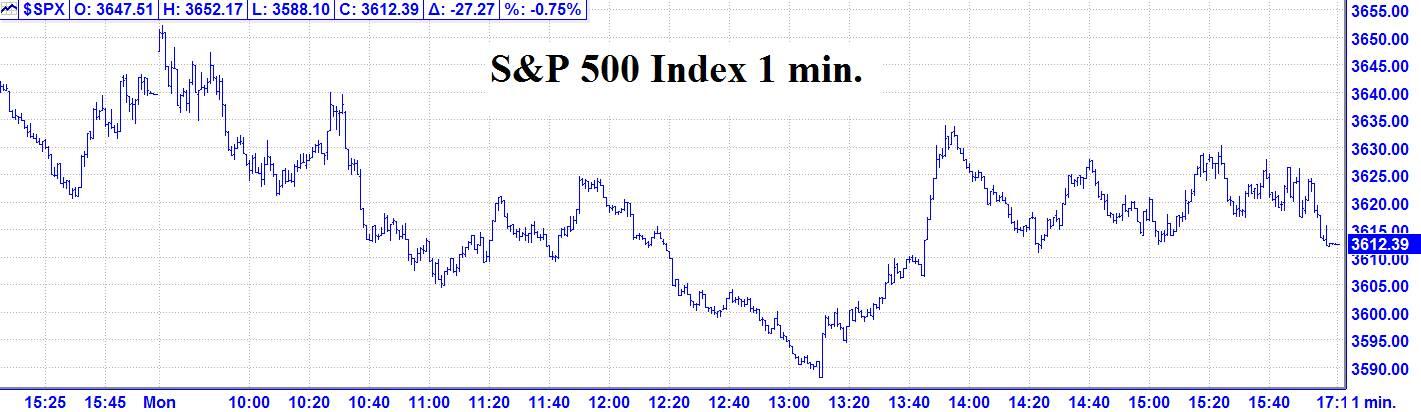
Recap 10/10 - The S&P opened with an 8 handle gap up and then traded another 3 handles higher for an opening minute high of the day. From that high, the S&P zig zagged 62 handles lower into a 1:10 PM low of the day. From that low, the S&P rallied 46 handles into a 1:55 PM high. From that high, the S&P declined 22 handles into a 2:24 PM low. From that low, the S&P traded in a 14 handle range with a downward bias into the close.
10/07 – The major indices, following a small gap up opening continued lower to test the September 30 low. A good afternoon rally lifted the markets to finish with the following closes: DJIA – 93.91; S&P 500 – 27.27 and the Nasdaq Comp. - 110.30.
Looking ahead – Monday, following an up opening, which was not constructive for establishing a low, took the S&P to 3588 for a test of the September 30 low 3584. That is now the major support level. Time will expire on our major change in trend window after the first hour on Tuesday. Any low that has been established by then, must hold. Any new lows after that, will invalidate our signal. If that happens, stand aside.
The Now Index is in the BUY ALERT ZONE. This is a cautionary indication that there is a moderate imbalance of too many shorts. This is not an outright buy signal.
Coming events
(Stocks potentially respond to all events).
2. B. 10/07 AC – Uranus 90 US Moon. Major change in trend US Stocks, T-Bonds, US Dollar.
C. 10/07 AC – Uranus Contra-Parallel US MC. Major change in trend US Stocks, T-Bonds, US Dollar.
D. 10/07 AC – Pluto in Capricorn turns Direct. Major change in trend Cocoa, Coffee, Hogs, T-Bonds.
E. 10/07 AC – Mercury Max. Elongation West. Major change in trend Corn, Oats, Soybeans, Wheat.
F. 10/07 AC – Full Moon in Aries. Major change in trend Financials, Grains, Precious Metals.
Market Math
10/07 = 961 (31^) days > 2/19/2020 MAJOR HIGH.
10/08 = 5476 (74^) > 10/11/2007 MAJOR HIGH.
10/13 = 967 (Music) days > 2/19/2020 MAJOR HIGH.
10/18 = 287 (Music) days > 1/04/2022 MAJOR HIGH.
10/20 = 289 (13^) days > 1/04/2022 MAJOR HIGH.
Fibonacci – 10/10, 10/18, 10/21, 10/24.
*S&P –10/10.
Astro – *10/10*, 10/20, 10/24, 10/28 AC.
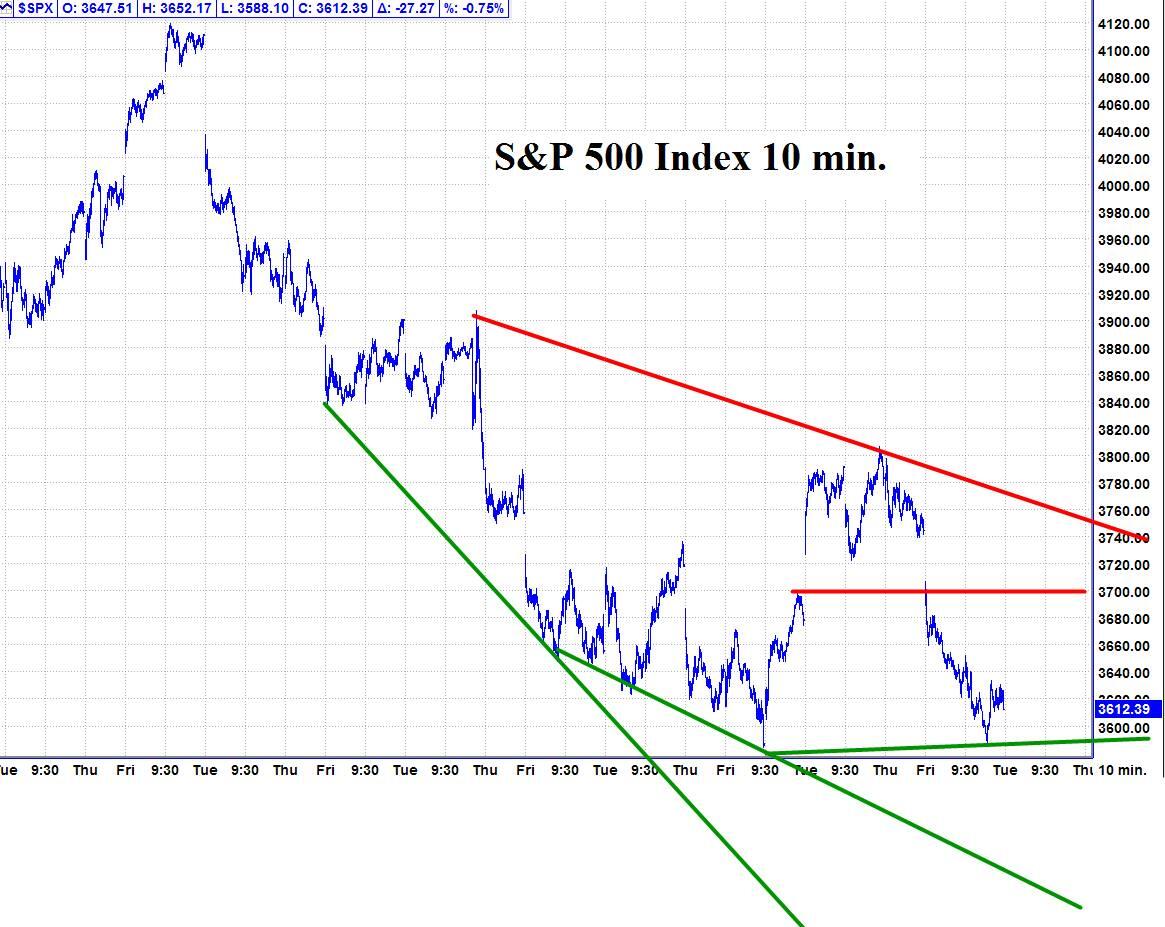
Please see below the S&P 500 10 minute chart.
Support - 3585, 3520 Resistance – 3700, 3760.
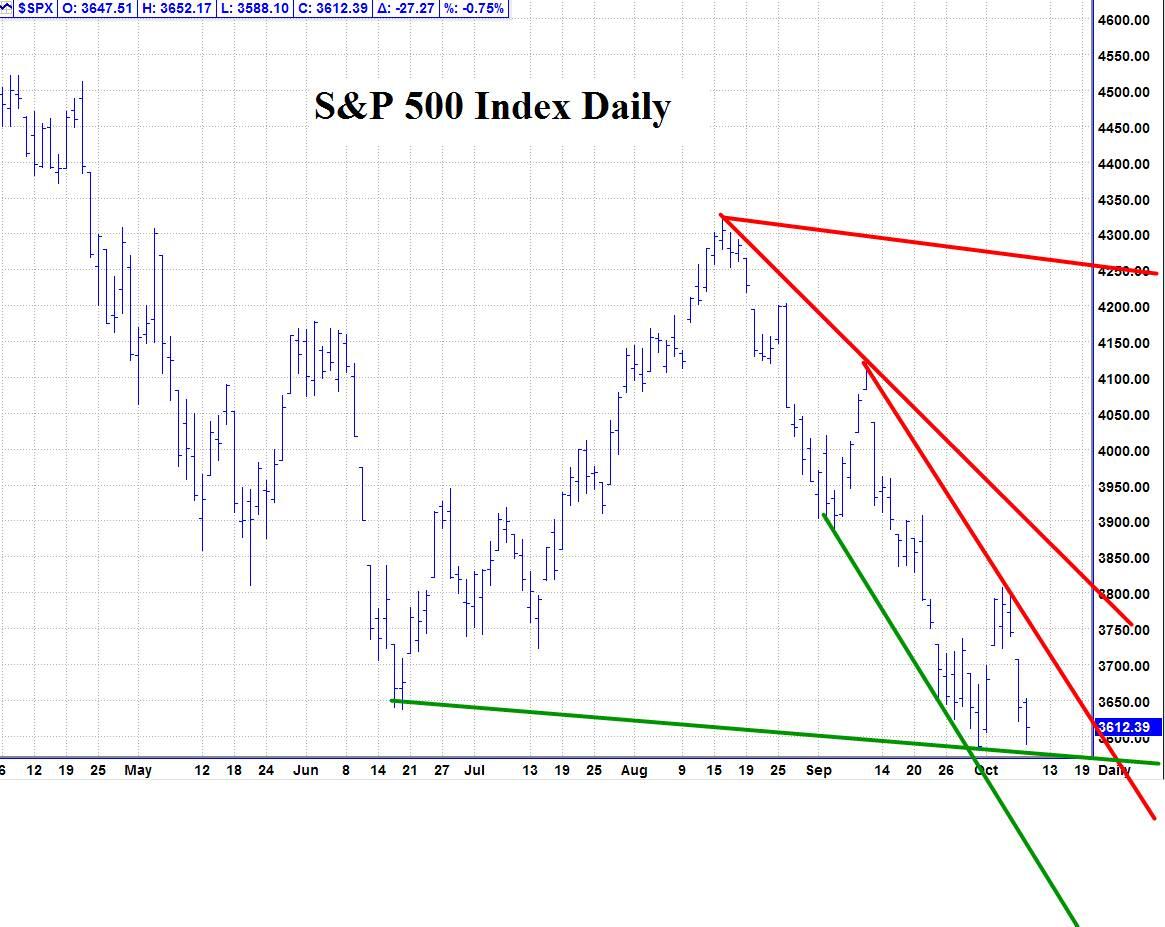
Please see below the S&P 500 Daily chart.
Support - 3585, 3520 Resistance – 3700, 3760.
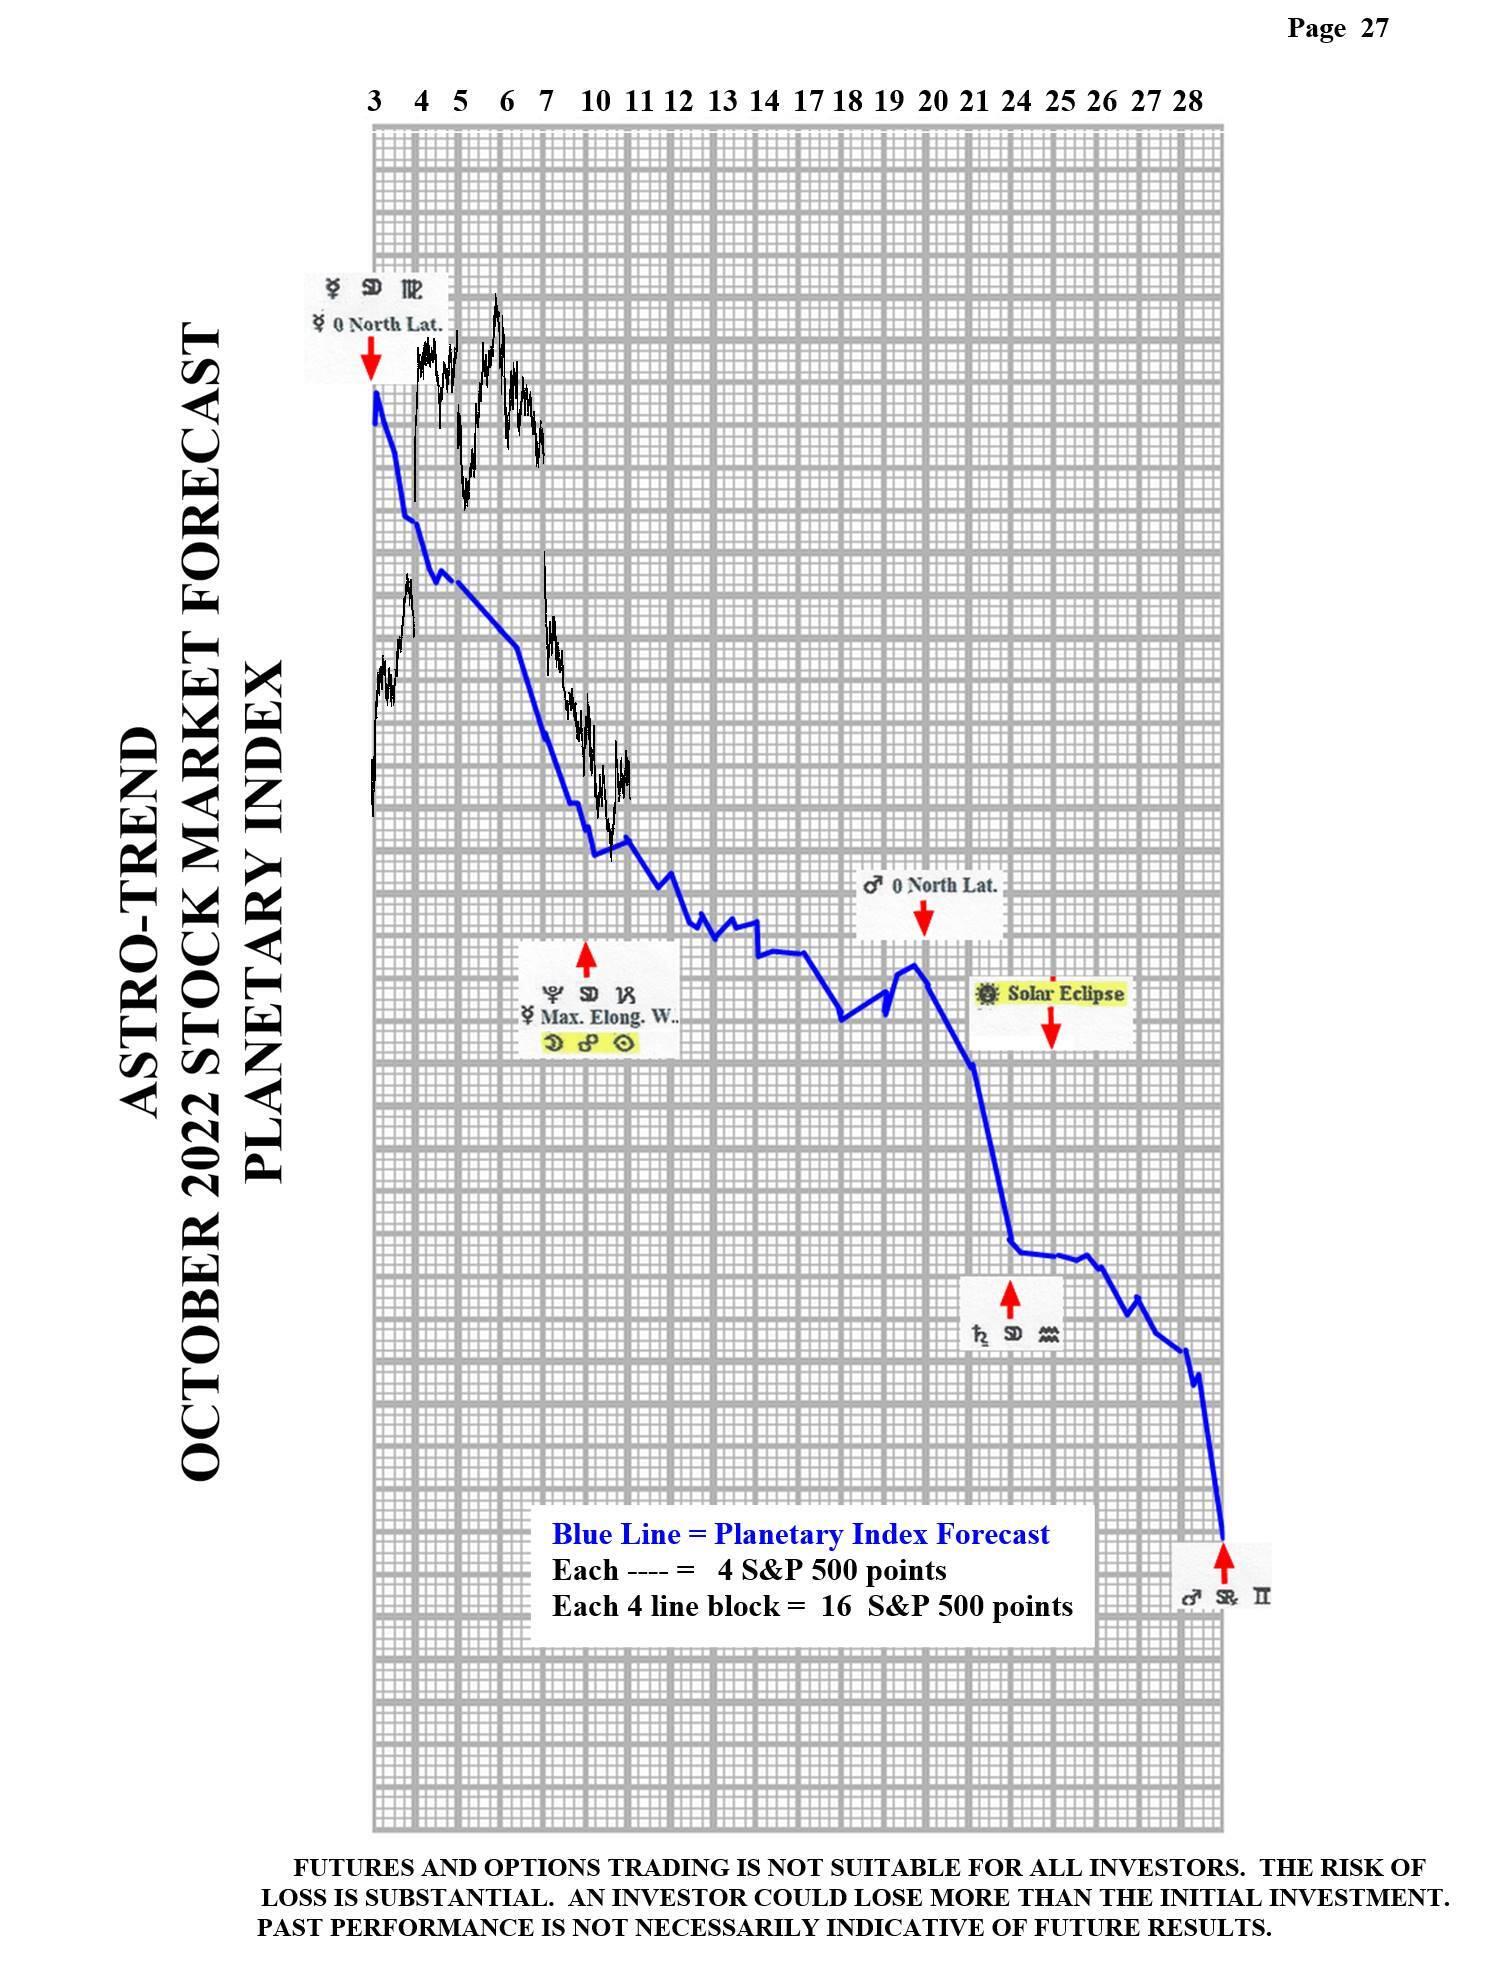
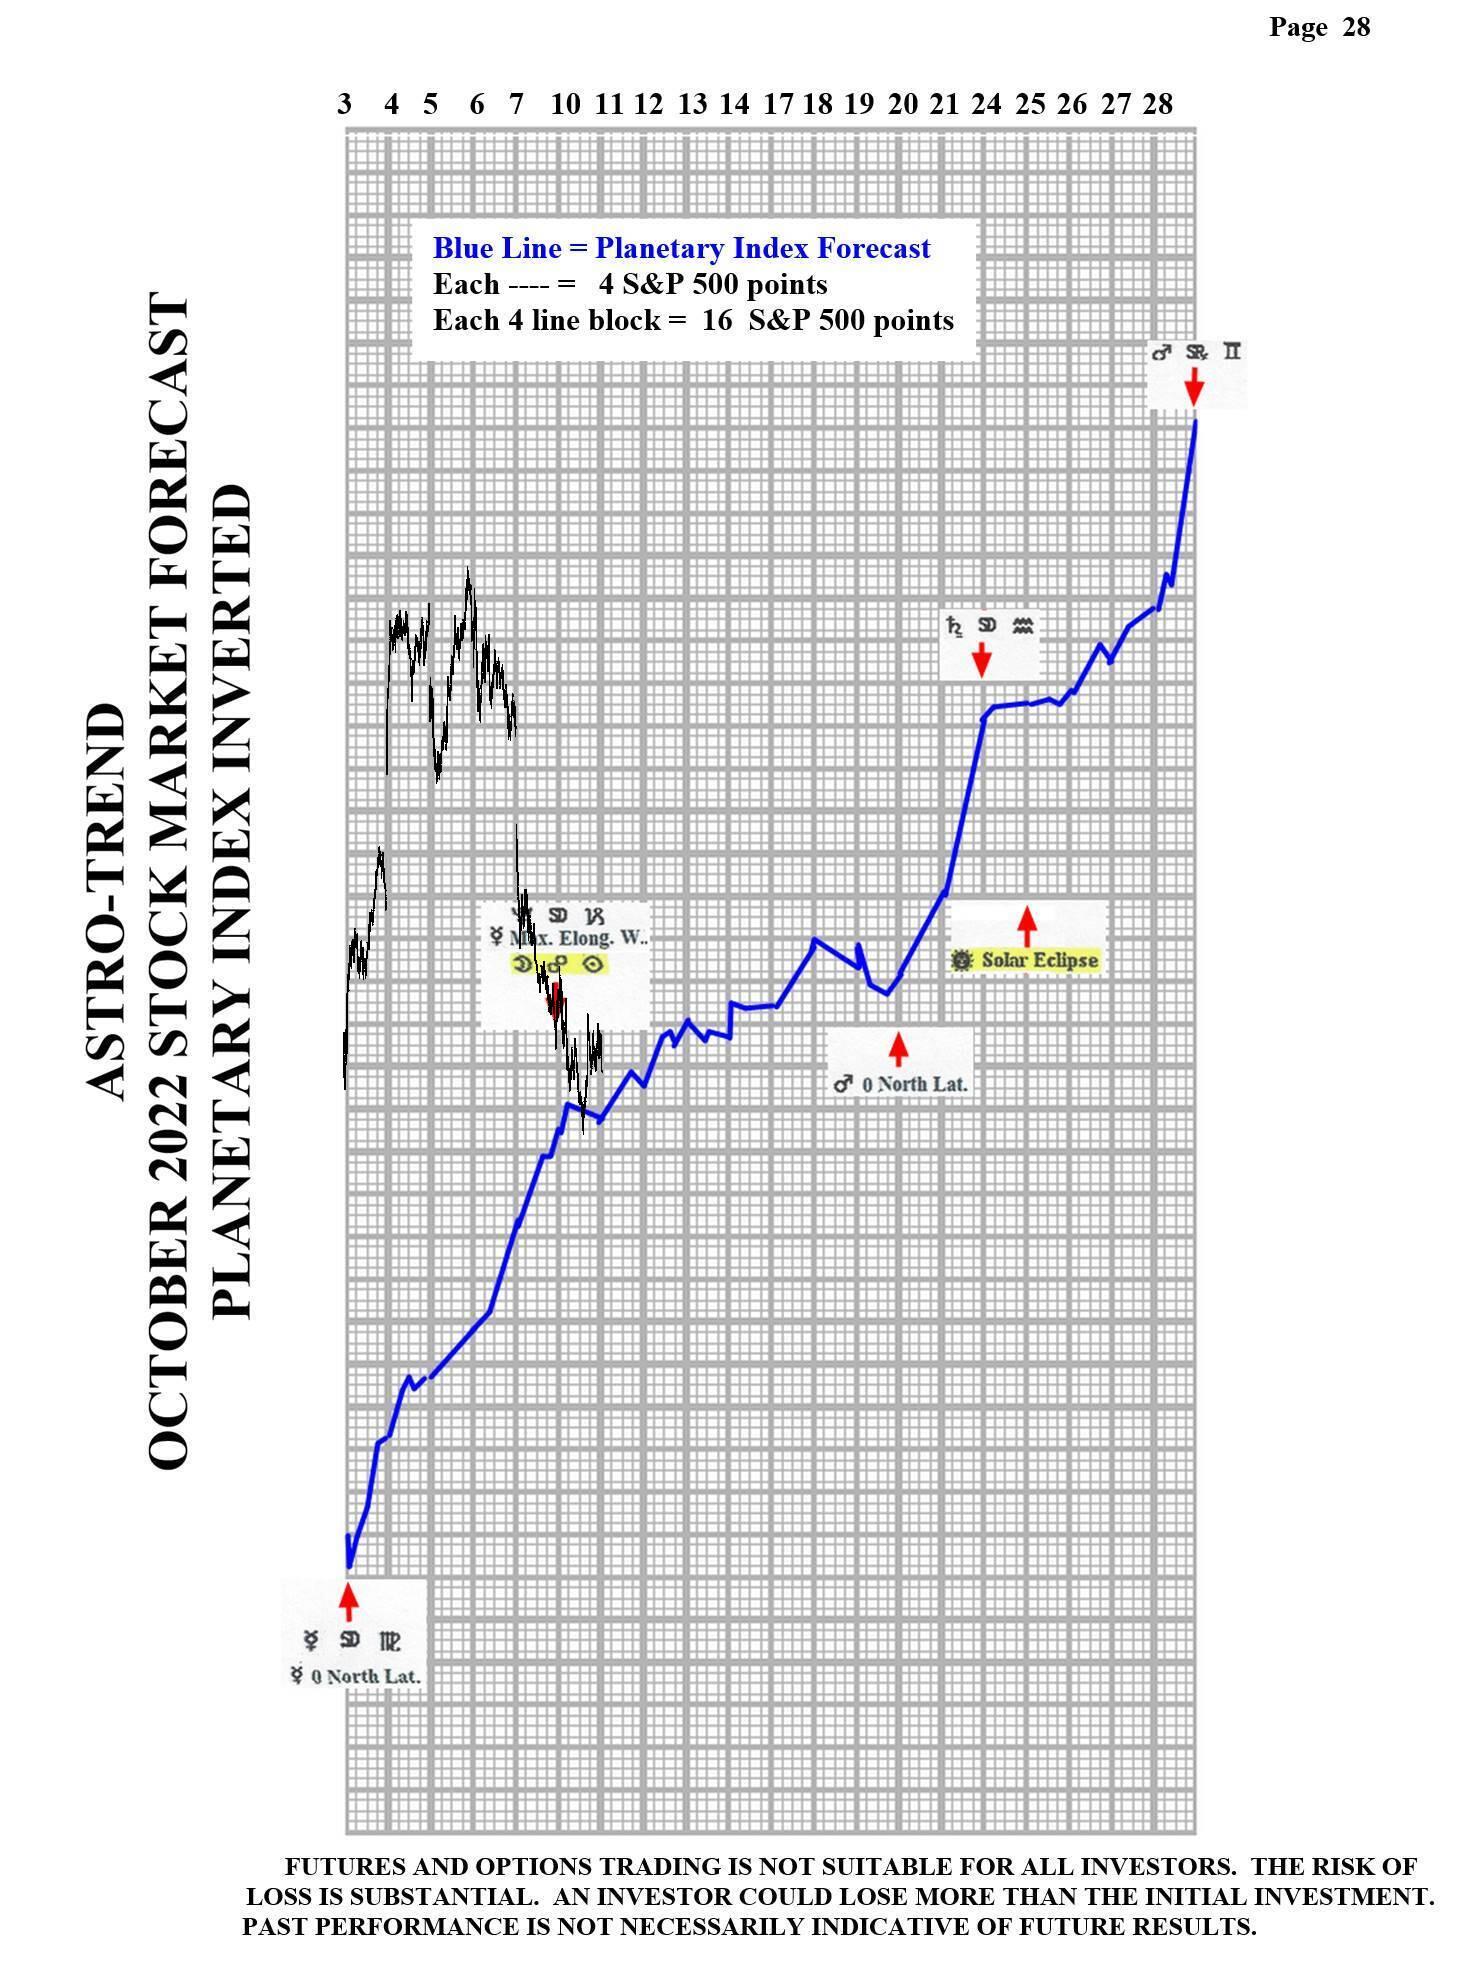
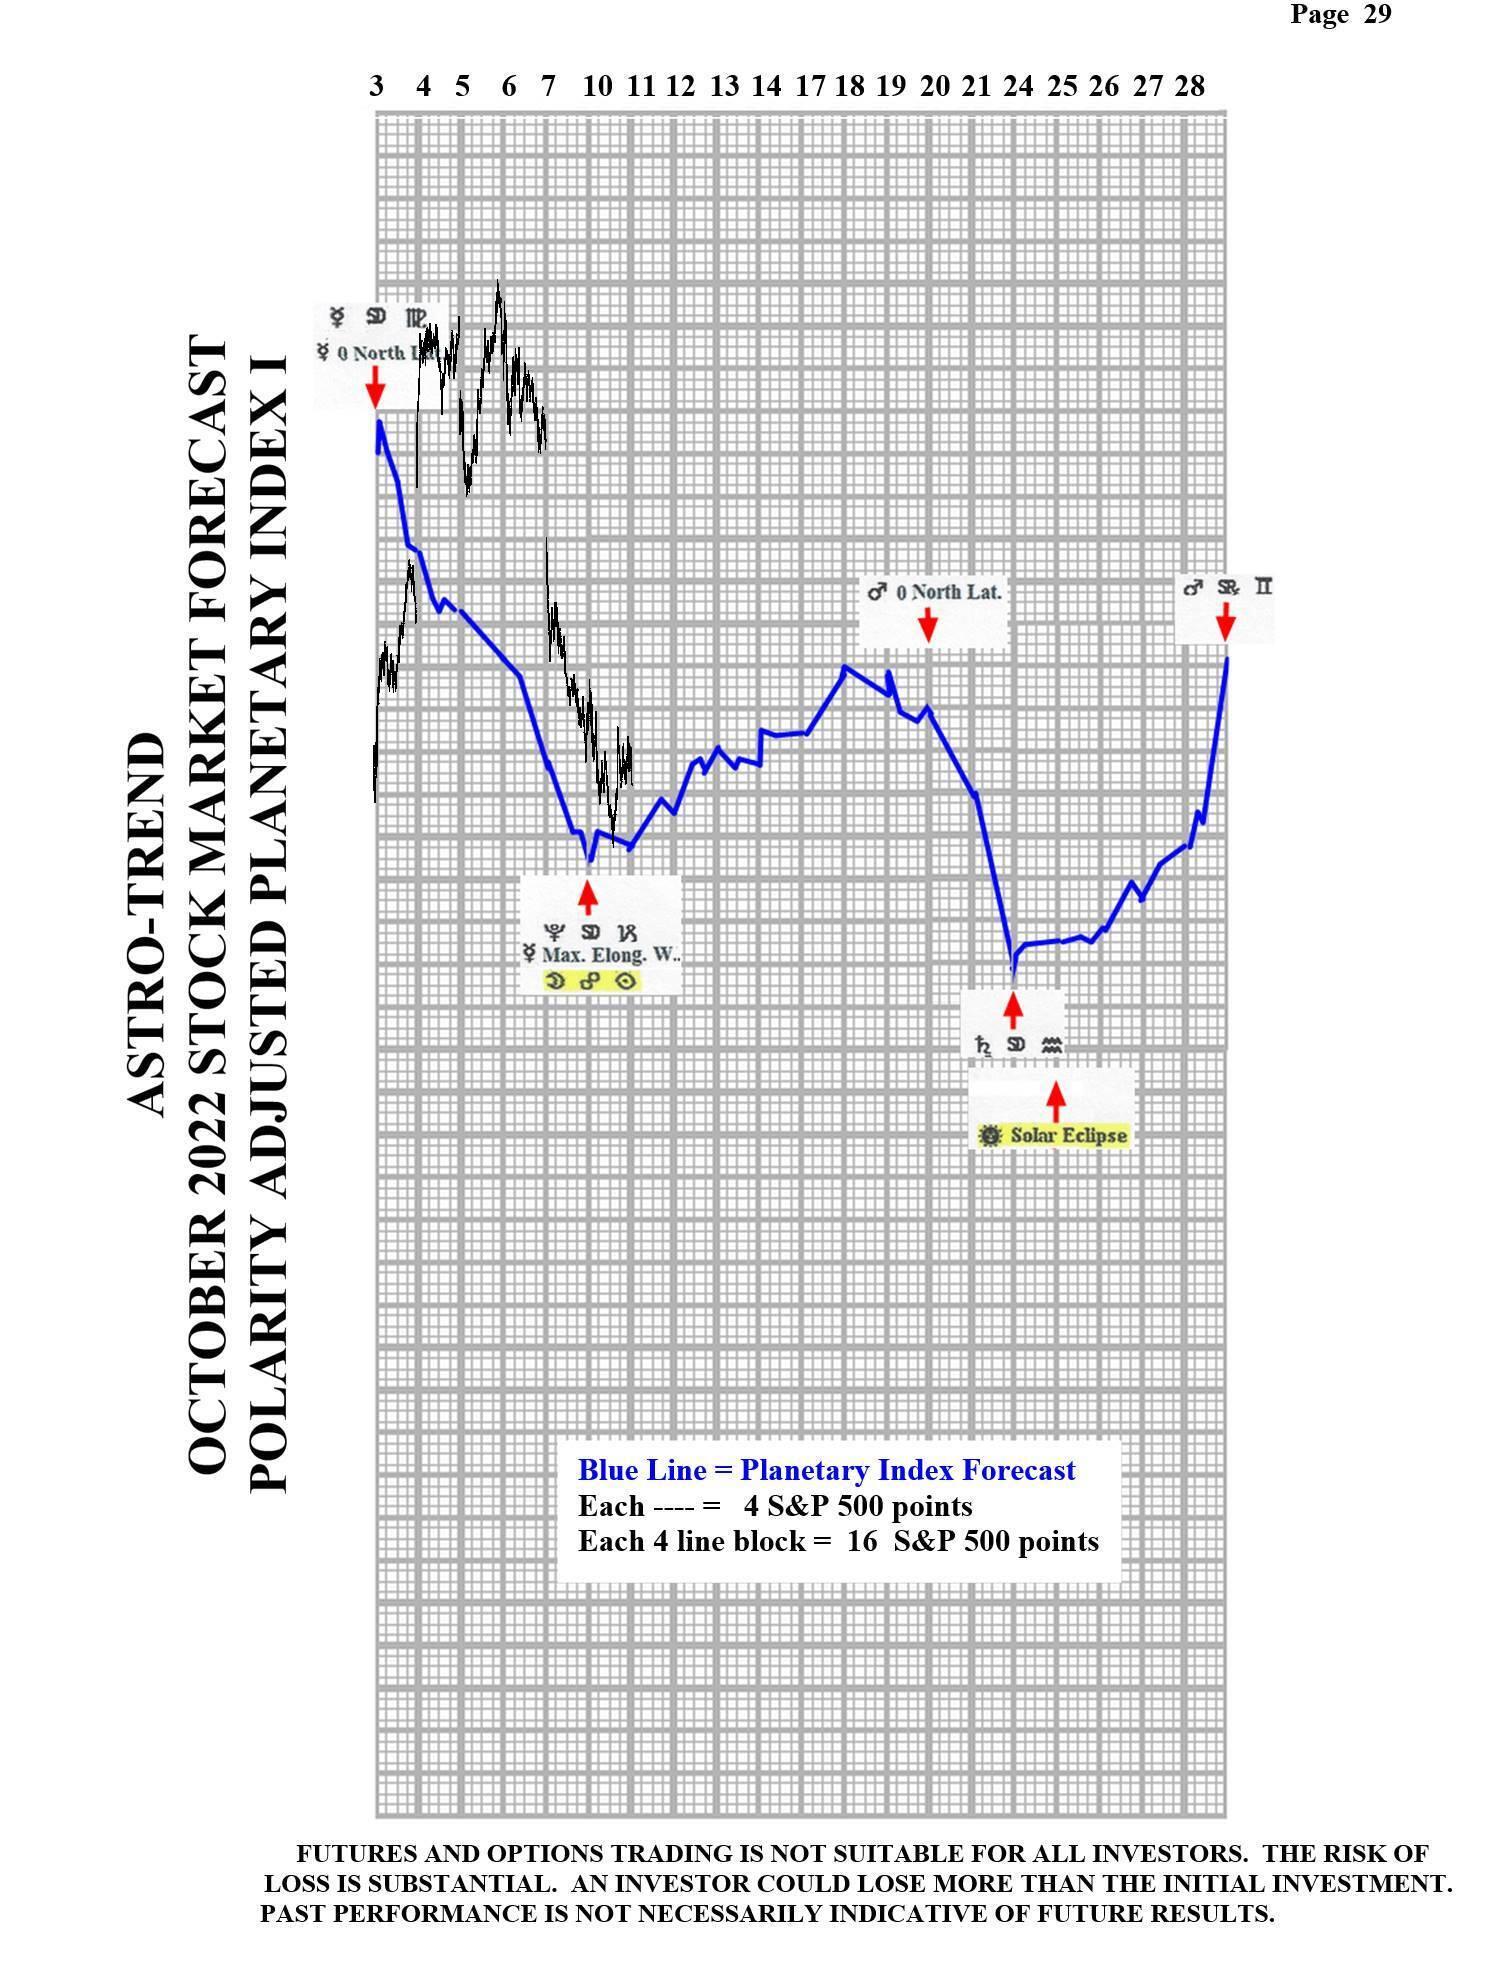
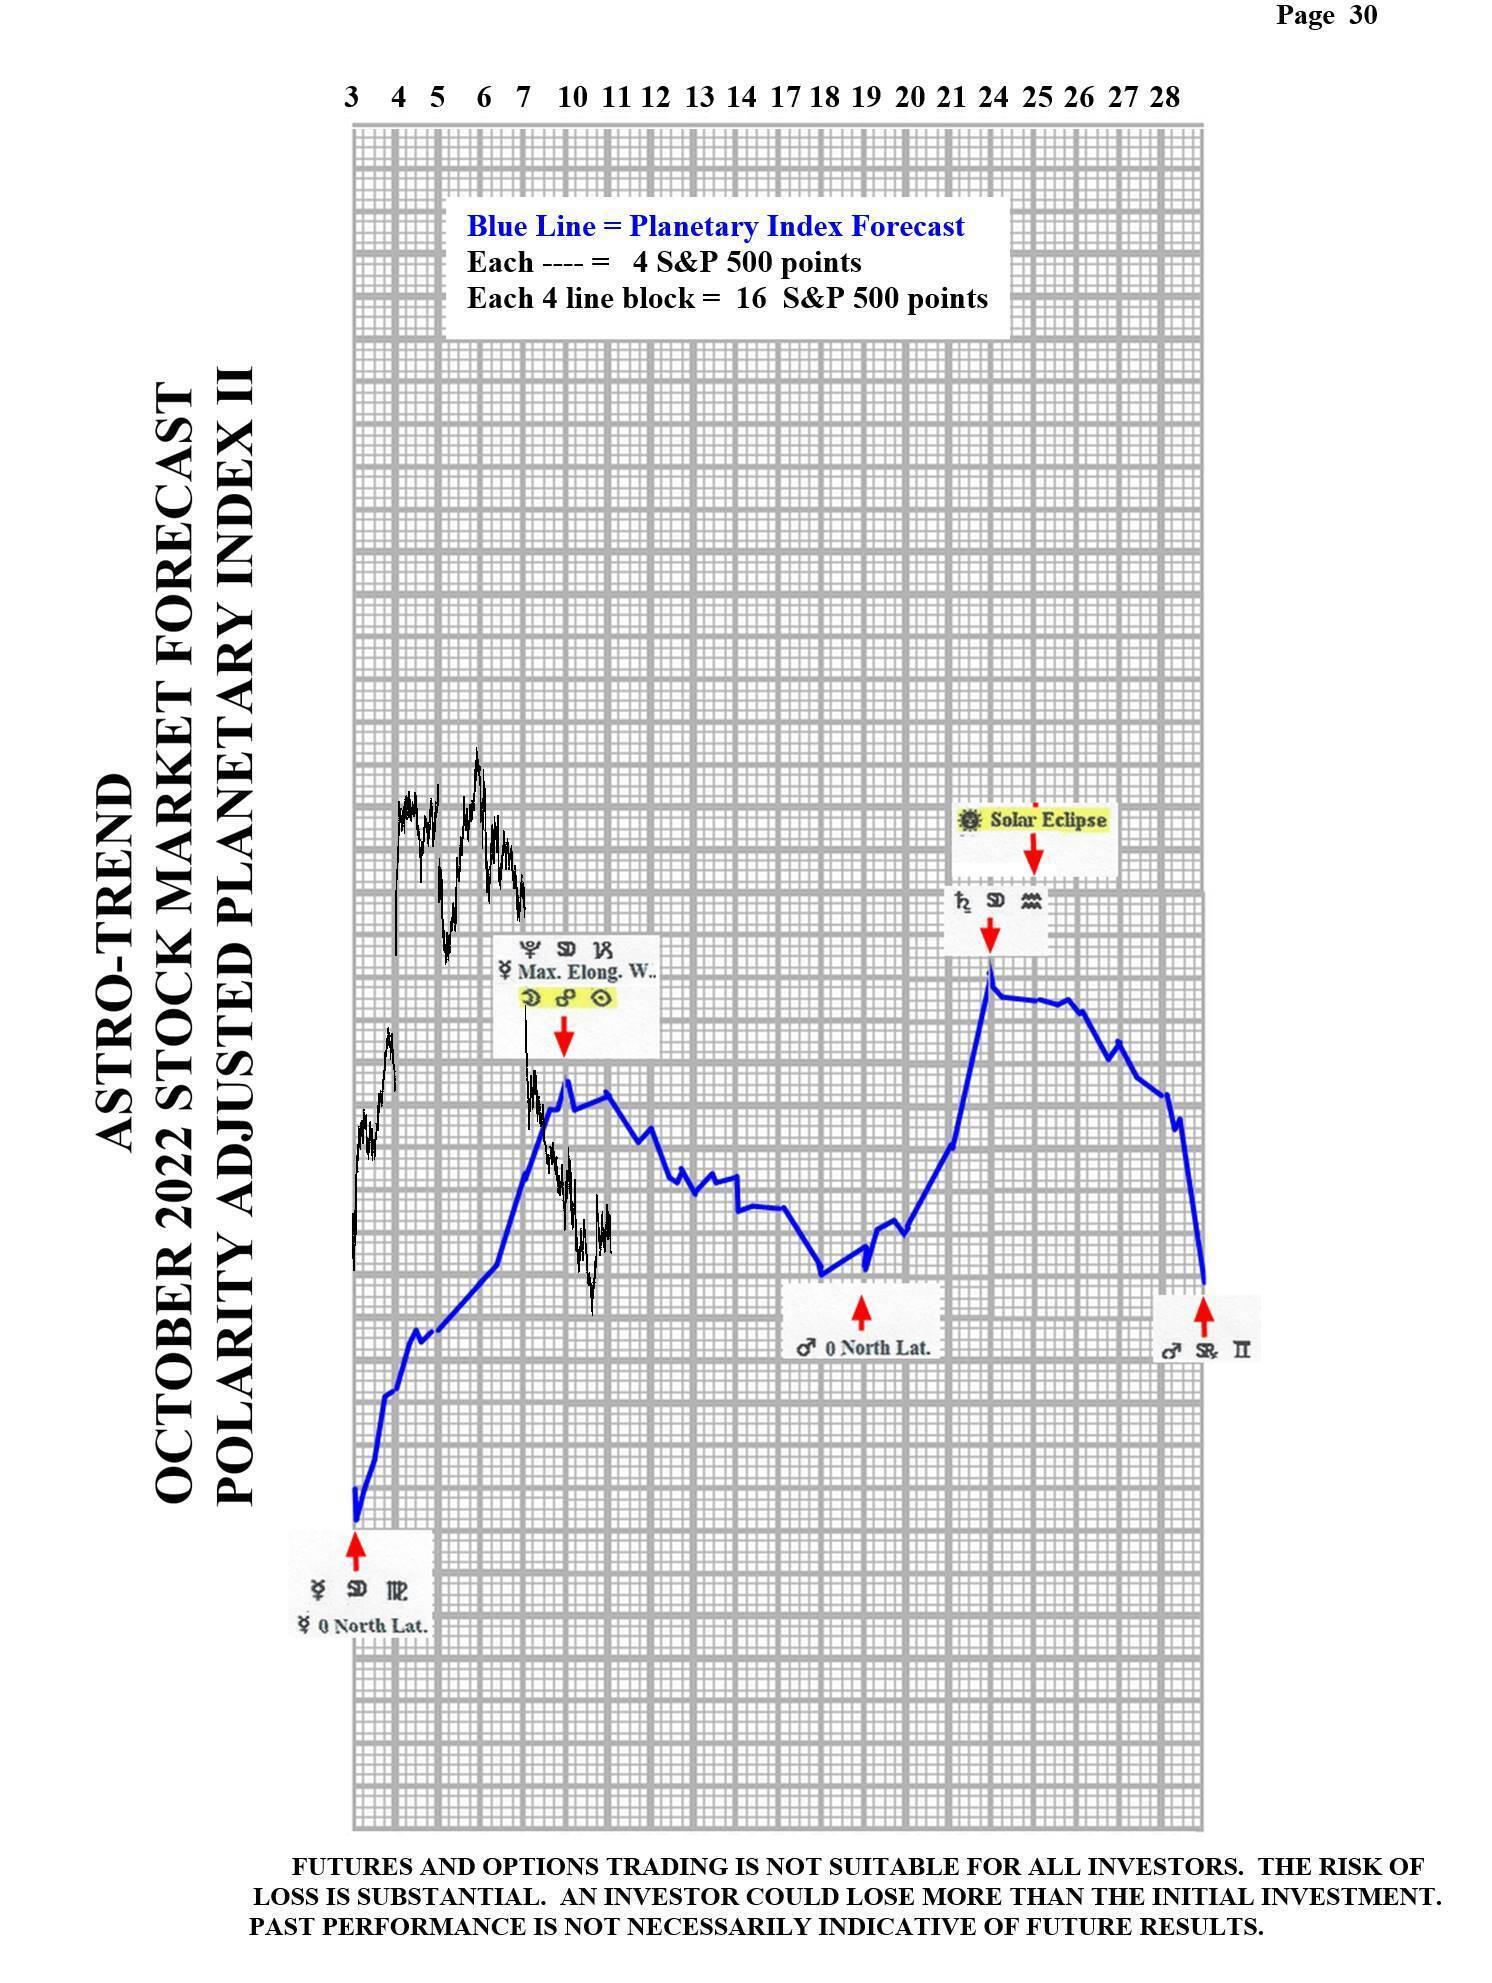
Please see below the September Planetary Index charts with S&P 500 5 minute bars for results.
Author

Norm Winski
Independent Analyst
www.astro-trend.com


