Fed Quantitative Tightening (QT) doubles this month, progress since June

The pace of QT allegedly doubles in September from the initial targets that started in June. Will that happen?
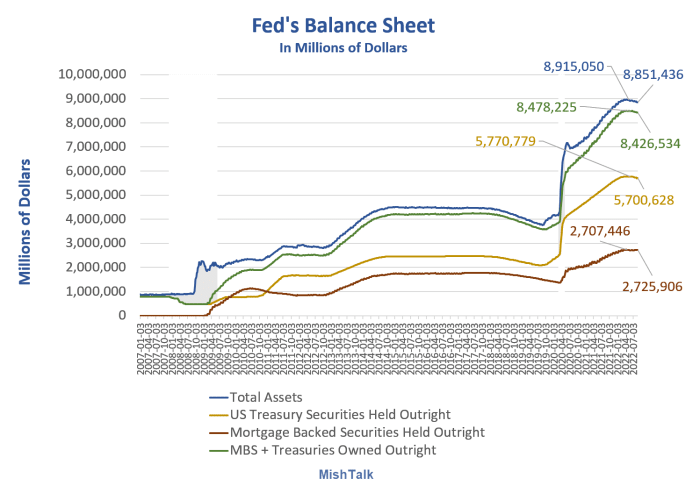
Balance Sheet Data from St. Louis Fed, chart by Mish
Plans for reducing the size of the Federal Reserve's balance sheet
- In January 2022, the Fed announced an intention to start QT.
- In May, the Fed announced its Plans for Reducing the Size of the Federal Reserve's Balance Sheet.
- In June the Fed finally got around to doing QT.
- From January until March, despite a housing market totally out of control, the Fed kept doing QE (both treasuries and mortgage backed securities (MBS)
Plan caps
- Beginning on June 1, principal payments from securities held in the System Open Market Account (SOMA) will be reinvested to the extent that they exceed monthly caps.
- For Treasury securities, the cap will initially be set at $30 billion per month and after three months will increase to $60 billion per month. The decline in holdings of Treasury securities under this monthly cap will include Treasury coupon securities and, to the extent that coupon maturities are less than the monthly cap, Treasury bills.
- For agency debt and agency mortgage-backed securities, the cap will initially be set at $17.5 billion per month and after three months will increase to $35 billion per month.
June 1, 2022 assets
- Total Assets: 8,915,050
- Treasuries: 5,770,779
- MBS: 2,707,446
August 24, 2022 assets
- Total Assets: 8,851,436
- Treasuries: 5,700,628
- MBS: 2,725,906
Three-month apparent progress
- Total Assets: 8,915,050 - 8,851,436 = 63,614
- Treasuries: 5,770,779 - 5,700,628 = 70,151
- MBS: 2,707,446 -2,725,906 = -18,460
Apparent progress notes
The key word regarding progress is the word "apparent".
On August 20, I commented Yes, Quantitative Tightening by the Fed is Really Happening
Here is an explanation from Joseph Wang, a former senior trader who handled QE trades for the Fed.
MBS Holdings Really Are Declining
The Fed’s MBS holdings are decreasing, even if this is obscured by the sawtooth pattern of its holdings, which arises from the repayment and settlement schedule of MBS, wherein MBS bonds receive principal repayments on the 25th of the month and newly purchased MBS settle on the 15th of the month. The spikes in Fed MBS holdings arise from the settlement of newly purchased MBS; the declines are due to principal repayments. The Fed is still receiving MBS principal repayments each month that must be reinvested, so its MBS holdings continue to show periodic spikes even as overall MBS holdings are declining.
The Fed’s policy of settling MBS purchases within a three-month window adds another wrinkle to understanding Fed MBS holdings. The Fed is the largest investor in the MBS market and aims to minimize any potential disruption by postponing MBS settlement if it judges that postponement would improve market functioning. This means some of the increases in the Fed’s MBS portfolio could arise from purchases conducted three months ago, including purchases from reinvesting principal received the period between the end of QE and the start of QT. These delayed settlements are recorded as commitments to buy MBS and have steadily declined over the months. These commitments obscure the steady drop of Fed MBS holdings but will dissipate in a few months.
Just Wait for September
QT is taking place exactly as the Fed has telegraphed and the balance sheet declines will become more apparent in the coming months. Soon the QT pace will quicken, and all past-purchased MBS will have settled. From that time, the Fed’s balance sheet will clearly and steadily decline each month.
If you are interested in having a deeper understanding of how liquidity flows on the Fed’s balance sheet, you can check out my online course on the subject.
Exactly as telegraphed?
Not quite (depending on the meaning of telegraphed), and I suspect Wang might like to rephrase that.
Yes, Treasuries will proceed as telegraphed.
However, I doubt (as does Wang per a recent conversation) that the Fed will hit its MBS projections.
Projected principal payments
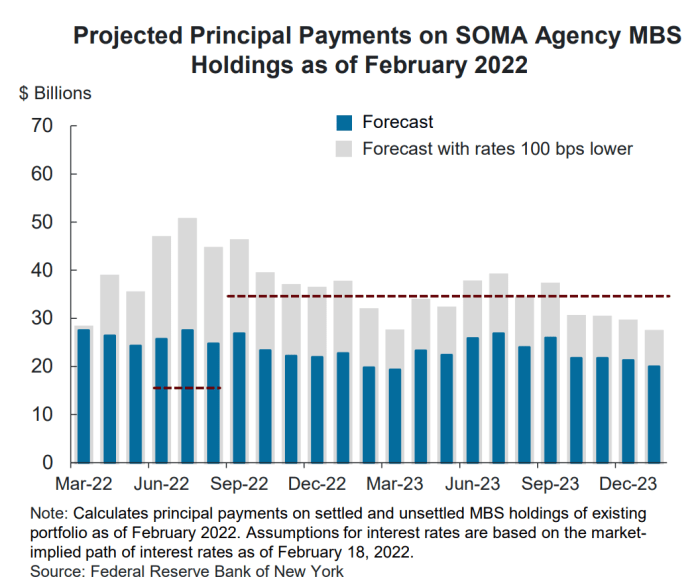
New York Fed Projected Payments
The New York Fed made those projections in February based on expected existing home sales. Well, guess what?
Existing home sales
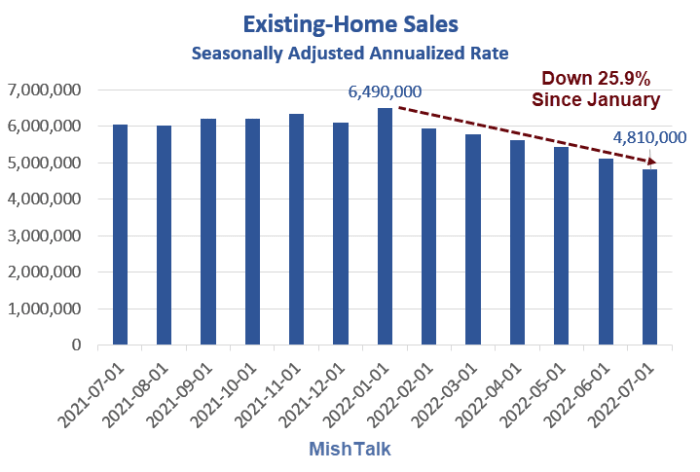
Existing Home Sales courtesy of NAR via St. Louis Fed, chart by Mish
- March 18: Existing Home Sales Dive 7.2 Percent Wiping Out January's Big Month
- April 20: Existing Home Sales Decline Again, But the Big Bust Starts Next Month
- May 19: Existing Home Sales Skid to Pre-Pandemic Level, a Housing Bust is Underway
- June 21: Existing Home Sales Skid Another 3.4 Percent in May, Down Fourth Month
- July 20: Existing Home Sales Dive Another 5.4 Percent in June, Down Fifth Month
- August 18: Existing Home Sales Fall 5.9 Percent, Down Sixth Consecutive Month
Existing home sales are down 25.9 percent since January.
The New York Fed projections from February did not take this into consideration yet were still insufficient to meet the $35 billion per month cap that starts this month.
To be fair, one can claim the Fed set "caps" not targets. Regardless, the Fed will likely not come close to its MBS QT [cap/target] no matter which word you choose.
It will hit the caps on treasuries.
Mortgage rates
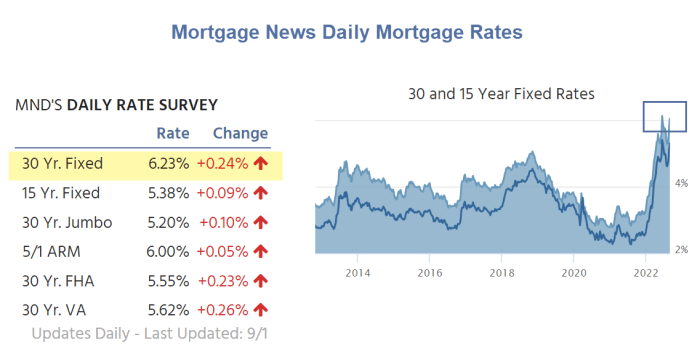
Meanwhile, please note mortgage rates spiked nearly a quarter point today and sit just below the June high of 6.28 percent.
These are the highest rates in the Mortgage News Daily series. One would have to go back to October of 2008 to find a higher Freddie Mac rate.
Home prices have peaked, Case-Shiller data lags, now what?
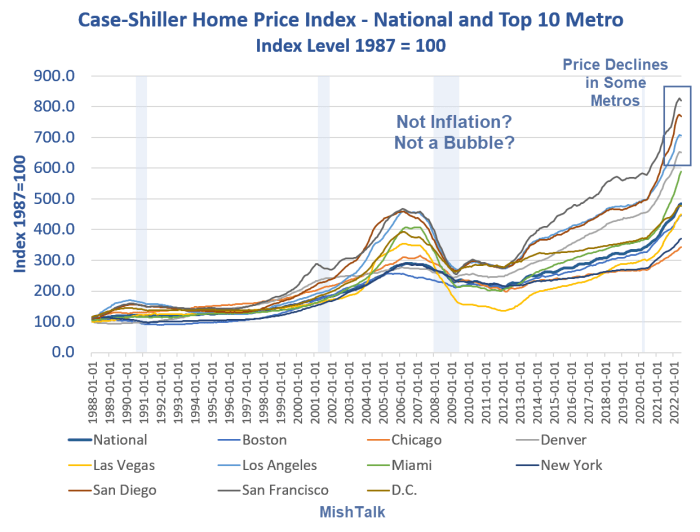
Yesterday, I noted Home Prices Have Peaked, Case-Shiller Data Lags, Now What?
At these mortgage rates, it would take a price crash to jump start housing.
Don't count on a crash happening soon or helping if it does. Mortgage rates could keep rising and The Fed is Openly Cheering the Stock Market Plunge Following Jackson Hole.
Author

Mike “Mish” Shedlock's
Sitka Pacific Capital Management,Llc
Mike “Mish” Shedlock is a registered investment advisor for SitkaPacific Capital Management.