EURUSD Elliott Wave Technical Analysis

Summary: It looks most likely that price may overall rise to about 1.20761 over the next three to eight months. Within the expected rise, there may be a sharp pullback or time consuming sideways consolidation for a B wave.
ELLIOTT WAVE ANALYSIS
MONTHLY CHART

The (0) is from where the wave count begins.
A large zigzag can be seen complete at the low in March 2015. This is labelled Super Cycle wave (w).
A low now below this point indicates that the larger structure downwards is incomplete. The Elliott wave structure that fits best here is a double zigzag.
The first zigzag in the double is complete; it is labelled Super Cycle wave (w). The double is now joined by a complete three in the opposite direction, an expanded flat labelled Super Cycle wave (x). Because Super Cycle wave (x) ends just short of the cyan bear market trend line, it looks like it is over there.
Super Cycle wave (y) is most likely now to unfold as a zigzag.
While double zigzags and double combinations are labelled the same, W-X-Y, they are very different structures.
Double zigzags, like single zigzags, normally have a strong counter trend slope. To achieve this their X waves are usually brief and shallow. The second zigzag in the double usually moves reasonably beyond the end of the first zigzag, so that the whole structure has a strong slope.
Double combinations are sideways movements. To achieve a sideways look their X waves are usually deep and can also often be time consuming. The second structure in the double usually ends about the same level as the first, so that the whole structure takes up time and moves price sideways.
Here, Super Cycle wave (x) is relatively shallow. This indicates a double zigzag is most likely unfolding lower.
The bear market trend line may be expected to continue to provide resistance while the bear market for EURUSD remains intact.
DAILY CHART
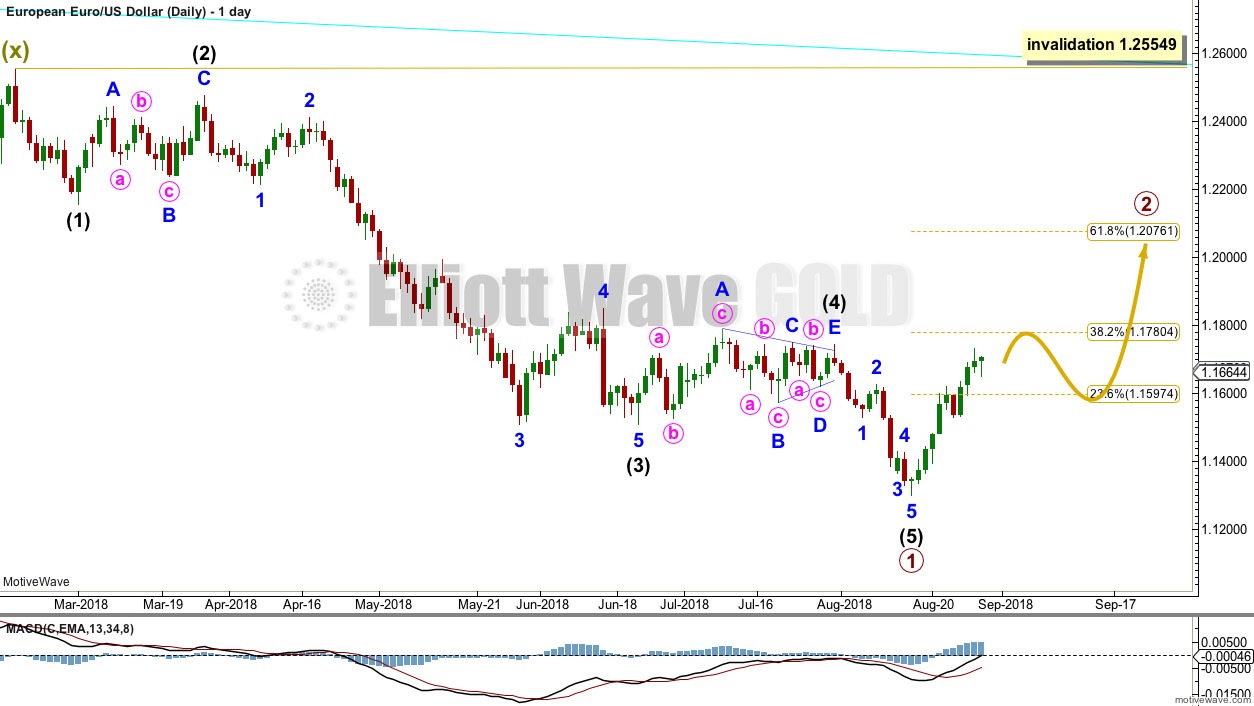
This daily chart focusses on the start of Super Cycle wave (y).
A new wave down at Super Cycle degree should begin with a five down. At this stage, that looks to be complete; it is labelled as primary wave 1.
Following a five down, a three up should develop. This is labelled primary wave 2.
Primary wave 1 lasted six months. Primary wave 2 may be expected to last from at least a Fibonacci three months up to a more likely Fibonacci five or eight months. Primary wave 2 must subdivide as a corrective structure. It would most likely end about the 0.618 Fibonacci ratio of primary wave 1, but it could be deeper than that.
TECHNICAL ANALYSIS
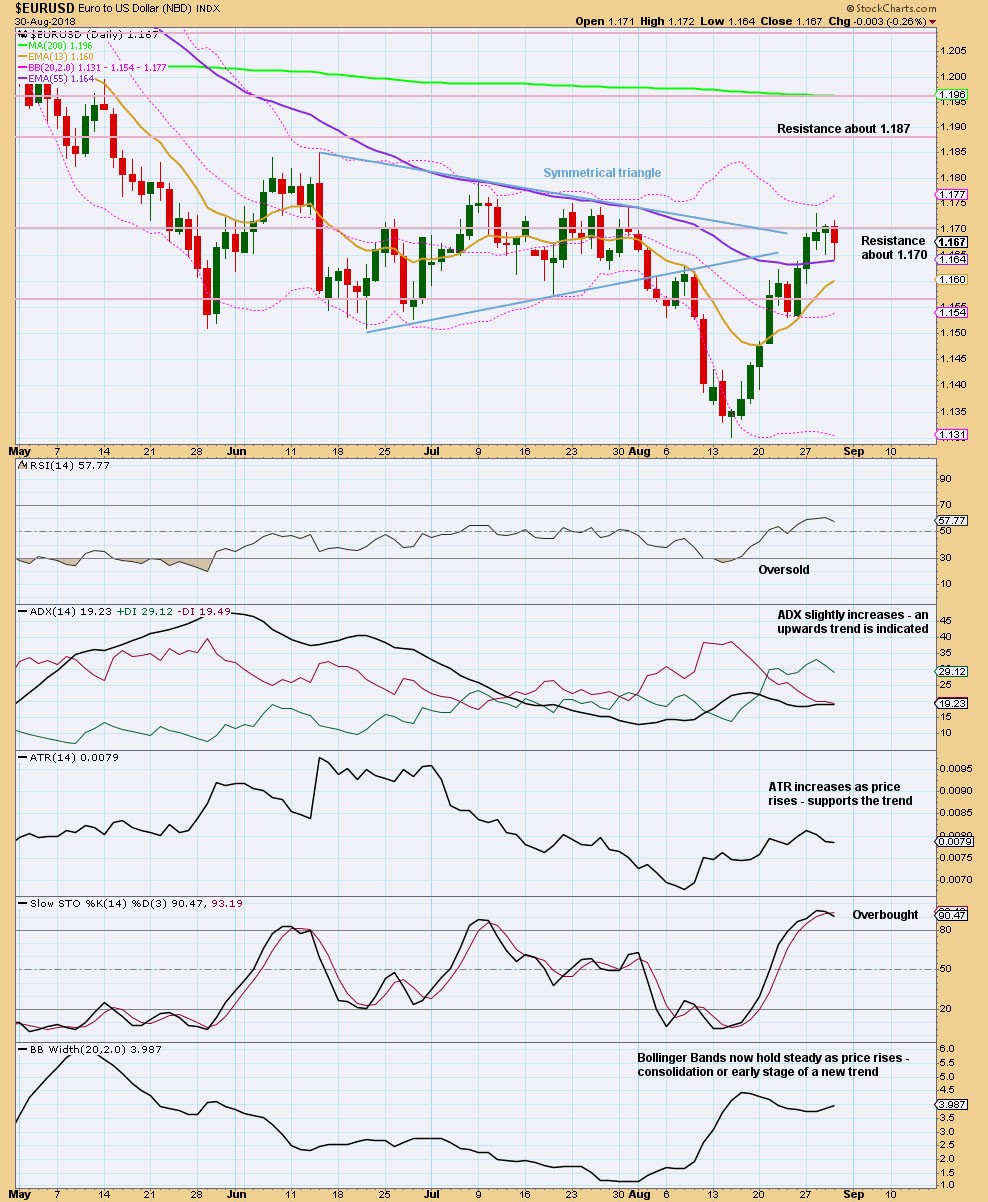
The symmetrical triangle noted in last analysis completed and saw a breakout to the downside. At that stage, a target using the measured rule would have been about 1.1278. Price fell short of this target by only 24 pips before turning.
Currently, price has reached resistance and Stochastics is overbought. However, Stochastics may remain overbought for some time. Not until it exhibits bearish divergence with price would a strong warning of a high in place be seen.
It looks like a new upwards trend may be developing. Look for next resistance about 1.187.
Overall, this analysis supports the Elliott wave count.
VOLUME ANALYSIS
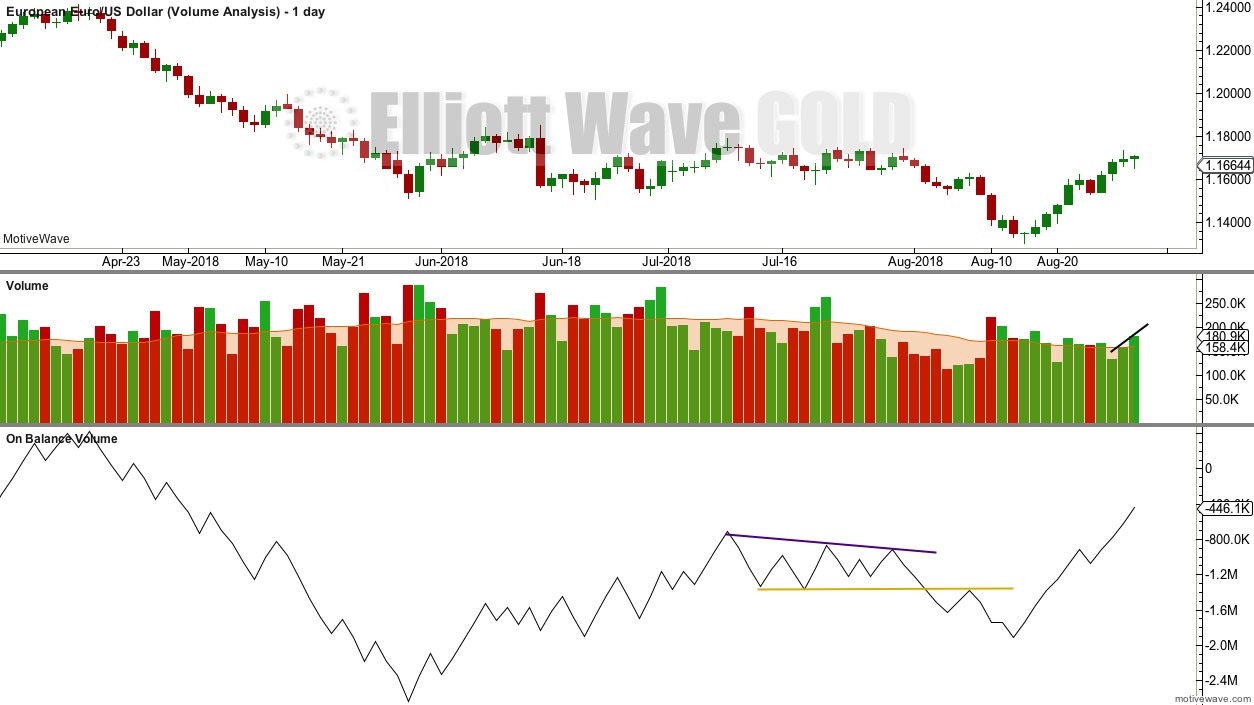
For the short term, volume supports upwards movement. On Balance Volume is very bullish. More upwards movement should be expected.
Author

Lara Iriarte, CMT
Elliott Wave Gold
Lara Iriarte is a Chartered Market Technician and a Registered Financial Advisor in New Zealand.


