EUR/USD: wait-and-see mode continues ahead of US news
EUR/USD Current price: 1.0799
View Live Chart for the EUR/USD
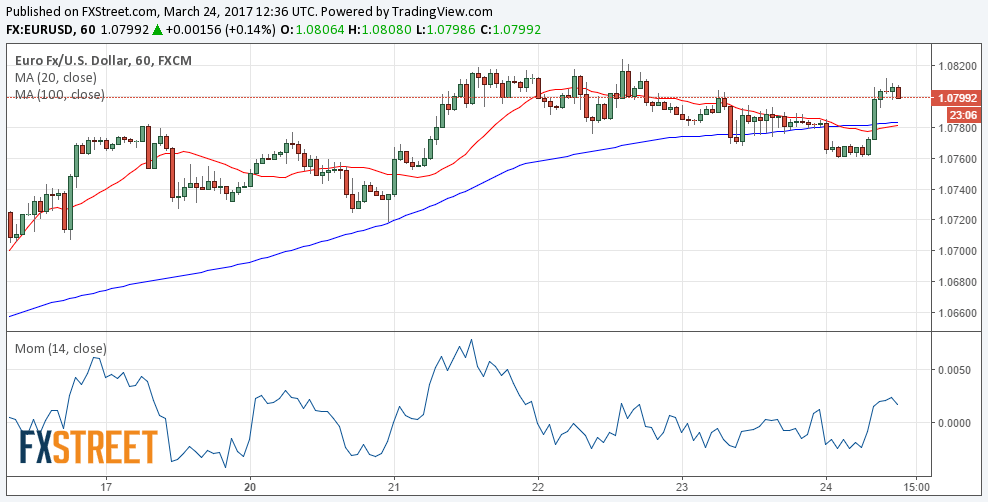
The EUR/USD pair eases from a daily high of 1.0812 ahead of Wall Street's opening, but as most major pairs, is trading in a well-limited intraday range. The release of the March preliminary Markit European PMIs indicated that the region continues to growth at its fastest pace in over five years, confirming the trend that surged late 2016. The economic recovery, which started in the services sector, is now even in manufacturing and services, resulting in the Composite PMI rising up to 56.7 from previous 56.0, its highest in almost five years. In the US, Durable Goods Orders for February came in better-than-expected, up by 1.7% from a previously revised 2.3%, although without transportation, the figure disappointed, advancing 0.5% against a 0.6% expected, against previous 0.2%. Previous month upward revisions are helping the greenback to advance modestly, although investors are waiting for the US Congress decision on the Obamacare bill, a major test for Donald Trump's administration, as if he gets approval, markets will likely recoup confidence in the Trump trade.
Still pending of release in the US is the preliminary March Markit manufacturing PMI, expected at 54.8 from previous 54.2, while it's still not clear whether the US Congress will vote today, or keep delaying the Obamacare repeal bill.
Technically, the 1 hour chart shows that technical indicators are retreating within positive territory, but also that the price remains around 1.0800 and above its 20 and 100 SMAs, this last indicating lack of selling interest. In the 4 hours chart, the price remains above a bullish 20 SMA, but technical indicators have turned lower around neutral territory, reflecting the ongoing range trading. At this point, the pair needs to extend above 1.0830 to confirm a bullish breakout and be able to advance further, while only below 1.0735 the risk will turn towards the downside.
Support levels: 1.0760 1.0735 1.0700
Resistance levels: 1.0830 1.0860 1.0900
GBP/USD Current price: 1.2483
View Live Chart for the GBP/USD
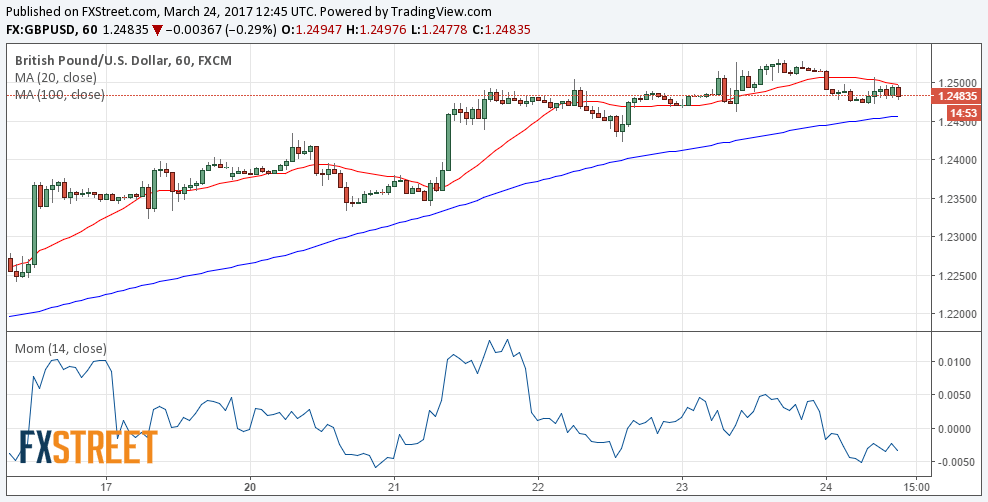
The GBP/USD pair trades below the 1.2500 level, but above 1.2460, the immediate support, unable to find direction, but holding near its March high set this Thursday at 1.2530. There were no major releases in the UK, although the kingdom released the BBA Mortgage Approvals figure, showing that household borrowing of £13.4 billion in February was 4.6% higher than in the same month last year, while house purchase approval numbers of 42,613 were 4.6% lower than in February 2016 and 3.5% lower than January but above the 2016 monthly average of 41,287. Short term, the pair presents an increasingly bearish tone, as it holds near its daily lows and meeting selling interest around a bearish 20 SMA in the 1 hour chart, whilst technical indicators have turned south within negative territory. In the 4 hours chart, the price is struggling around a bullish 20 SMA, whilst the Momentum indicator heads nowhere around its mid-line, and the RSI indicator heads lower around 56, limiting chances of a recovery rather than suggesting a downward move. Still, a break below 1.2460, should favor additional declines, firstly towards 1.2425, the 38.2% retracement of the January rally.
Support levels: 1.2460 1.2425 1.2380
Resistance levels: 1.2510 1.2540 1.2580
USD/JPY Current price: 111.06
View Live Chart for the USD/JPY
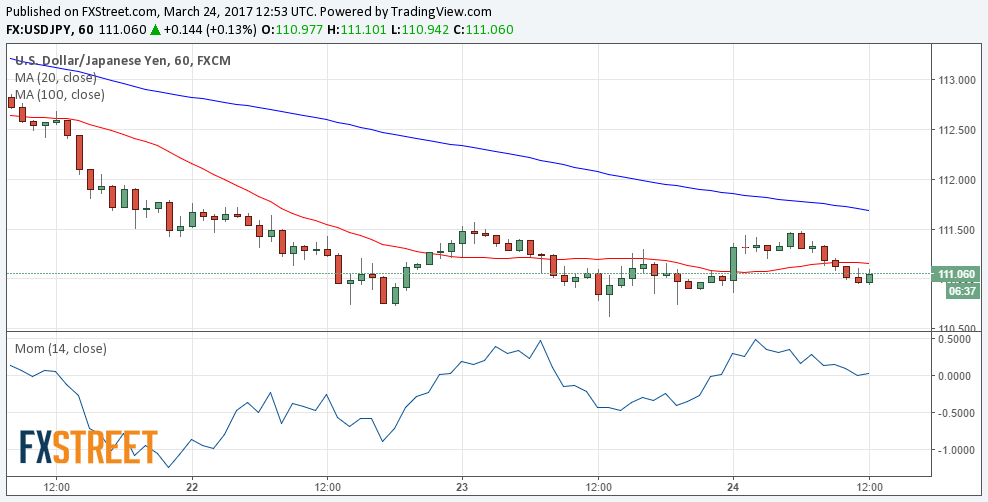
The USD/JPY pair managed to advance during the past Asian session, topping at 111.47 a lower high daily basis, before reversing its daily gains and trading a handful of pips above the 111.00 level ahead of Wall Street's opening, barely bouncing after mixed US Durable Goods data for February. Asian shares advanced, but European ones struggle around their opening levels, while yields remain pretty much unchanged daily basis, maintaining USD/JPY traders clueless. Exacerbating the absence of action is the upcoming US Congress decision, as speculative interest will likely wait for the vote of the Obamacare repeal bill, before compromising in a certain direction. The 1 hour chart presents a neutral-to-bearish stance, as the price remains well below bearish 100 and 200 SMAs, whilst the Momentum indicator has turned flat around its 100 level, and the RSI aims modestly higher around 43. In the 4 hours chart, technical indicators have bounced within bearish territory but remain below previous intraday highs, whilst the 100 SMA slowly turns south above the 200 SMA, both far above the current level. As long as the price remains below 111.60, the risk will be towards the downside, with renewed selling interest below 110.70 opening doors for a test of 109.90 a major long term Fibonacci support.
Support levels: 110.70 110.40 109.90
Resistance levels: 111.10 111.60 112.00
Author

Valeria Bednarik
FXStreet
Valeria Bednarik was born and lives in Buenos Aires, Argentina. Her passion for math and numbers pushed her into studying economics in her younger years.


