EUR/USD vs. EUR/CAD analysis reveals key trading opportunities

The analyst will conduct a detailed assessment of the EUR/USD vs. EUR/CAD relative strength charts, incorporating both technical analysis and macroeconomic perspectives, while integrating fundamental insights for a comprehensive evaluation.
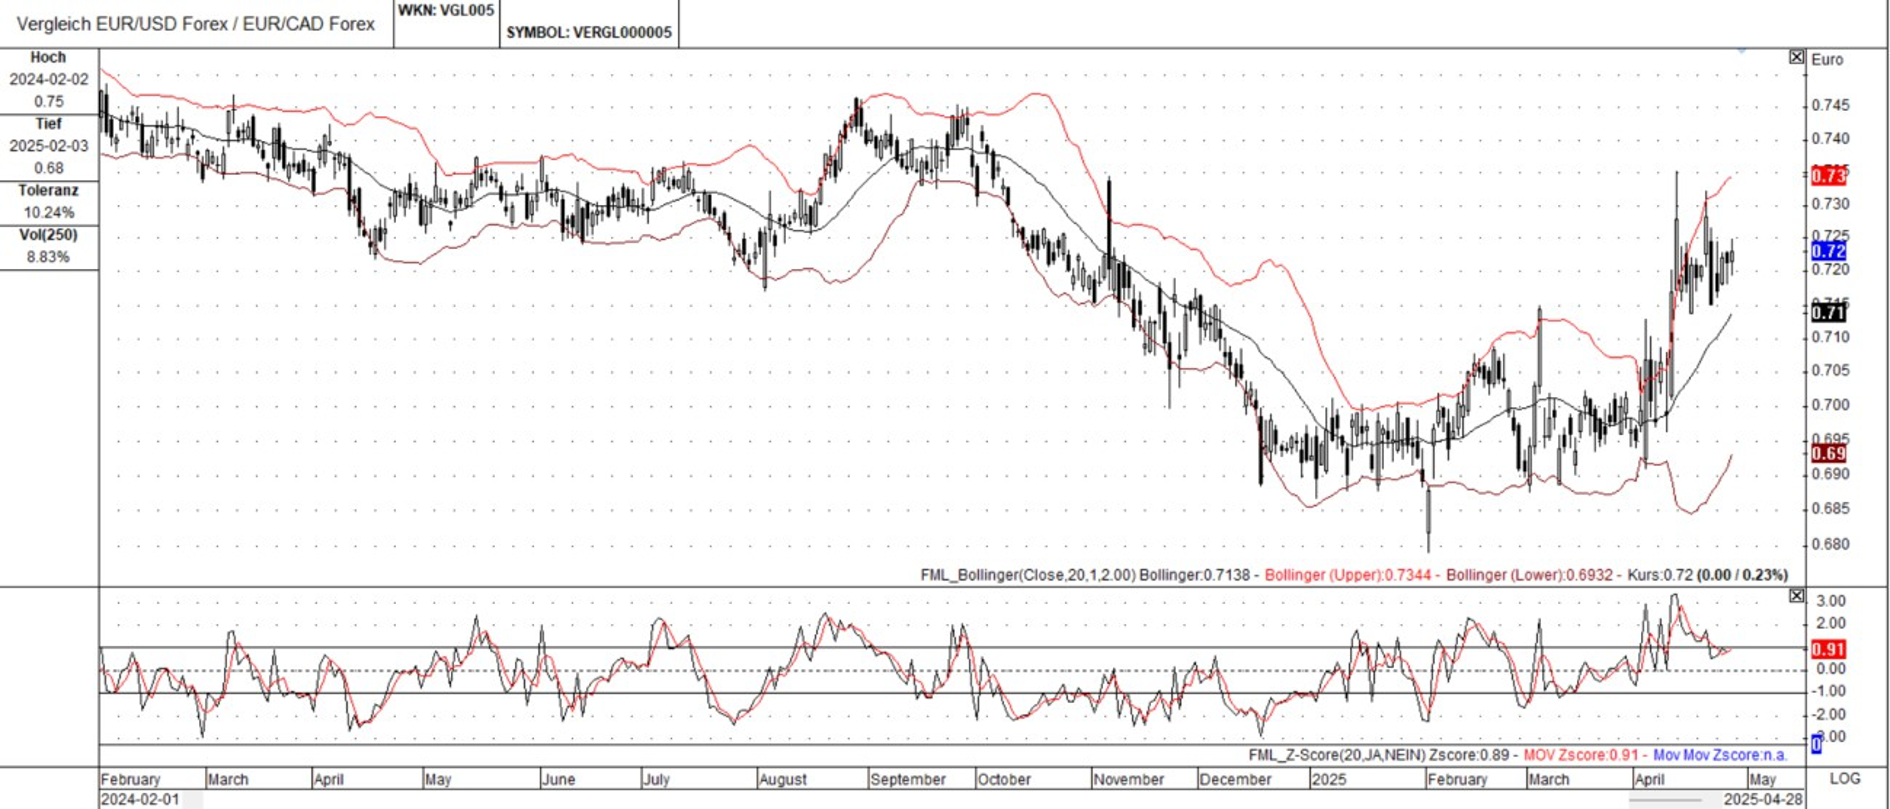
The chart clearly illustrates a downtrend prevailing from early 2024 until around late 2024. This indicates a period where the Euro was generally weakening against both the US Dollar and the Canadian Dollar. However, a notable trend reversal emerges in late 2024, transitioning into a distinct uptrend that extends into early 2025. This signifies a shift towards Euro strength relative to both currencies.
Initially, price action is predominantly confined below the middle Bollinger Band, reinforcing the downtrend. The middle band often acts as a dynamic resistance level during downtrends. The recent uptrend sees the price decisively breaking above the middle band and even testing the upper Bollinger Band. This suggests strong bullish momentum and increased volatility. The widening of the Bollinger Bands during the uptrend is a significant observation, as it indicates heightened volatility and reinforces the strength of the new trend.
The oscillator's movement mirrors the price action effectively. It registers oversold conditions during the downtrend, aligning with the Euro's weakness. Conversely, the oscillator moves into overbought territory during the recent uptrend, reflecting the Euro's relative strength. The current position of the oscillator in overbought territory suggests that the uptrend may be overextended, and a potential pullback or consolidation phase could be imminent.
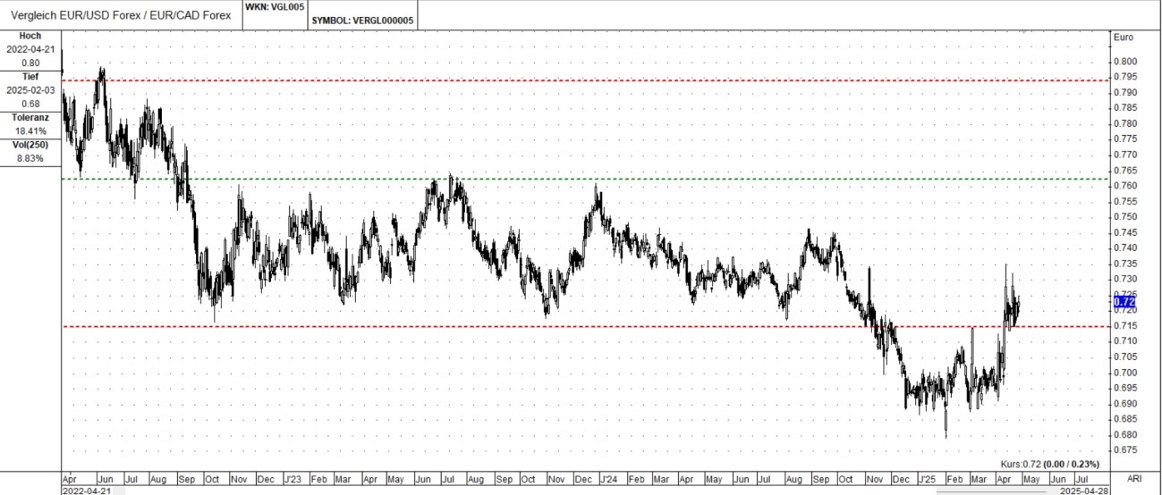
This chart provides a broader historical context, highlighting the overarching downtrend from around mid-2022 until late 2024. This longer-term perspective is crucial for understanding the significance of the recent uptrend. While the recent uptrend is evident, it's essential to recognize that it's still relatively small compared to the preceding downtrend. This implies that the uptrend could be a correction within a larger downtrend, or it could be the beginning of a more substantial reversal.
The horizontal red lines likely represent significant resistance levels, while the green lines may indicate support levels. These levels are crucial areas to watch for potential price reactions. The price is currently testing the lower resistance level. A decisive break above this level would strengthen the case for a more significant trend reversal. Conversely, a rejection at this level could lead to a continuation of the longer-term downtrend.
To provide a comprehensive analysis, we must consider the key macroeconomic factors influencing the Euro, the US Dollar, and the Canadian Dollar.
Eurozone macroeconomic factors
Economic growth: Eurozone GDP growth is a critical factor. Slower economic growth compared to the US or Canada can weaken the Euro. Monitor GDP reports and growth forecasts.
Inflation and monetary policy: The European Central Bank's (ECB) monetary policy (interest rates, quantitative easing/tightening) is paramount. Higher interest rates generally strengthen the Euro, while expansionary policies weaken it. Inflation levels in the Eurozone significantly influence the ECB's policy decisions.
Unemployment: Eurozone unemployment rates are an important indicator of economic health. Higher unemployment can put downward pressure on the Euro.
Political stability: Political events within the Eurozone (elections, policy changes, crises) can create uncertainty and affect investor confidence in the Euro.
US macroeconomic factors
Economic growth: US GDP growth, employment data (non-farm payroll), and other economic indicators significantly impact the US Dollar. Stronger US economic performance generally strengthens the Dollar.
Inflation and monetary policy: The Federal Reserve's (Fed) monetary policy (interest rates, quantitative tightening) is a primary driver of the US Dollar's value. Higher US interest rates tend to attract foreign investment, increasing demand for the Dollar and strengthening it.
Geopolitical events: Global events and US foreign policy decisions can also influence the US Dollar's strength.
Canadian macroeconomic factors
Commodity prices: Canada is a major exporter of commodities, particularly oil. Fluctuations in commodity prices, especially oil, have a significant impact on the Canadian Dollar. Higher oil prices tend to strengthen the Canadian Dollar.
Economic growth: Canadian GDP growth, employment data, and inflation rates influence the Bank of Canada's monetary policy and, consequently, the Canadian Dollar.
Bank of Canada policy: The Bank of Canada's interest rate decisions play a crucial role in determining the Canadian Dollar's value.
US-Canada economic relationship: The close economic ties between the US and Canada mean that US economic conditions and trade policies can indirectly affect the Canadian Dollar.
Relative strength dynamics (EUR/USD vs. EUR/CAD)
The relative strength chart of EUR/USD vs. EUR/CAD essentially illustrates how the Euro is performing against the US Dollar compared to how it's performing against the Canadian Dollar. If the chart is trending upwards, it means the Euro is gaining more strength against the US Dollar than it is against the Canadian Dollar, or it's losing less strength. If the chart is trending downwards, it means the Euro is gaining less strength against the US Dollar than it is against the Canadian Dollar, or it's losing more strength.
The recent uptrend in the EUR/USD vs. EUR/CAD chart suggests that the Euro has been outperforming both the US Dollar and, relatively, the Canadian Dollar. To understand this, we need to consider potential divergences in the macroeconomic factors mentioned above.
ECB vs. Fed/Bank of Canada: Is the ECB adopting a more hawkish stance (raising interest rates more aggressively) than the Fed or the Bank of Canada? This could explain the Euro's relative strength.
Commodity price impact: Are rising oil prices significantly benefiting the Canadian Dollar, thus making the Euro relatively weaker against the CAD, even if it's gaining against the USD?
Economic growth disparity: Is the Eurozone experiencing stronger economic growth relative to the US and Canada?
The technical signals from Bollinger Bands and Z-Score oscillator provide short-term confirmation of the Euro's recent relative strength. However, Chart 2 reminds us of the longer- term downtrend. The key resistance levels on Chart 2 are crucial. A sustained break above these levels would provide stronger confirmation of a trend reversal and suggest that the macroeconomic factors favoring the Euro are likely to persist.
Macroeconomic scenarios:
Bullish Euro scenario: If the ECB continues to raise interest rates aggressively to combat inflation while the Fed and Bank of Canada become more dovish (less aggressive in raising rates), and if Eurozone economic growth remains resilient, the uptrend in the EUR/USD vs. EUR/CAD chart could continue.
Bearish Euro scenario: If Eurozone economic growth weakens, or if the ECB becomes less hawkish due to concerns about a recession, or if oil prices decline significantly, the Euro could lose its relative strength, and the downtrend could resume.
The recent uptrend suggests potential long opportunities in EUR/USD and potentially fading EUR/CAD weakness, but with caution. Given the inherent volatility of forex, strict risk
management is crucial. Closely monitor economic data releases (GDP, inflation, employment), central bank announcements, and commodity price movements. Fundamental analysis will provide insights into the sustainability of the trends.
The relative strength chart of EUR/USD vs. EUR/CAD provides valuable insights into the Euro's performance against two major currencies. The recent uptrend warrants attention, but it's essential to analyze it within the context of longer-term trends and the underlying macroeconomic factors. A comprehensive approach that combines technical analysis with fundamental analysis is critical for making informed trading decisions.
Author

FxPro Traders Research Team
FxPro Traders
The FxPro Traders Research Team delivers advanced analysis and strategies designed to empower your success in today's dynamic forex markets.


