EUR/USD: short term bearish correction, dollar still weak

EUR/USD Current price: 1.0745
View Live Chart for the EUR/USD
Following a quiet Asian session, the greenback gains some ground against its major rivals, underpinned by news coming from the UK, as the Pound fell following news showing that the UK Government will trigger the Brexit next March 29th. The macroeconomic calendar has remained extremely light at the beginning of the week, with only Germany releasing its February PPI data, in line with expectations monthly basis, and up year-on-year to 3.1% from previous 2.4%. There's not much ahead after Wall Street's opening, except for a speech from Fed's Evans mid US afternoon, and another from US President Trump early Asia.
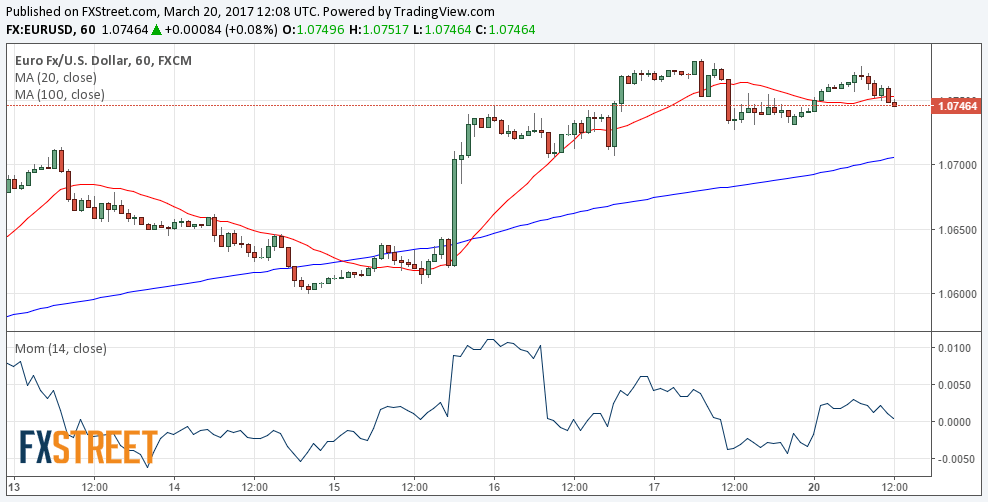
The EUR/USD pair trades near its daily low of 1.0736 achieved at the beginning of the day, set to correct lower in the short term, as in the 1 hour chart, the price is below a horizontal 20 SMA, whilst technical indicators head south, the Momentum around 100 but the RSI already at 44. In the 4 hours chart, the price has also moved below a horizontal 20 SMA whilst technical indicators also head south around their mid-lines, indicating however, a limited downward scope at the time being. As long as the critical support area around 1.0700 holds, the risk will remain towards the upside, albeit a break above 1.0782 is required to confirm further gains, up to 1.0820 a major Fibonacci resistance.
Support levels: 1.0735 1.0700 1.0660
Resistance levels: 1.0785 1.0820 1.0860
GBP/USD Current price: 1.2378
View Live Chart for the GBP/USD
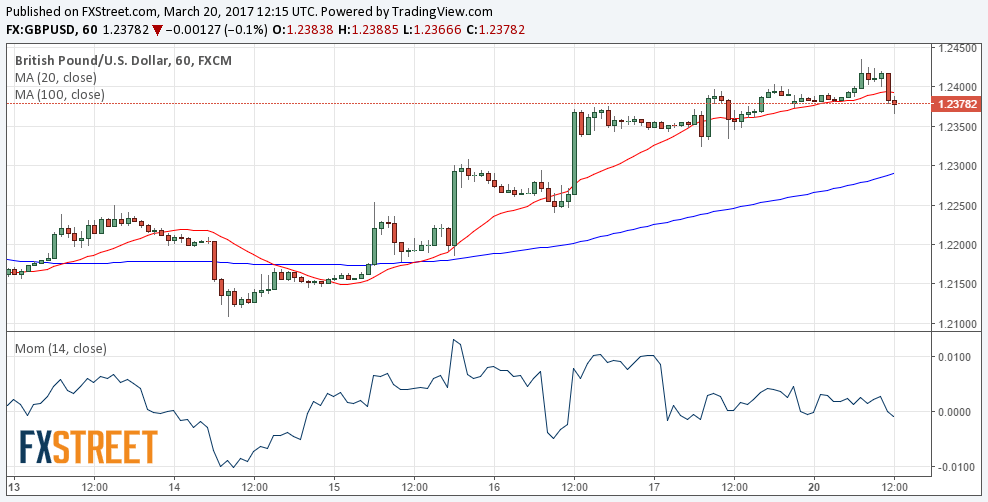
After peaking at 1.2435 the GBP/USD pair is in retreat mode, down to 1.2365 daily basis on headlines announcing that the UK will trigger the Art. 50 of the Lisbon treaty next March 29th, kick starting the two-year process of leaving the EU. Earlier on the day, the UK released its Nationwide house price index which showed that house prices held near multi-year lows, up by 1.3% in the month from previous 2.0%, and unchanged yearly basis at 2.3%. From a technical point of view, the pair has reached a major resistance, as it pared gains around the 38.2% retracement of the January's rally. Short term, the price has broke below its 20 SMA in the 1 hour chart, but technical indicators have turned flat within neutral territory, indicating a limited bearish potential, moreover as the pair quickly bounce some 20 pips from the mentioned low. In the 4 hours chart, technical indicators have turned flat well above their mid-lines, and after correcting overbought conditions, whilst the 20 SMA continues advancing below the current level, not far below 1.2345, the support to break to confirm a bearish move, as the level stands for the 50% retracement of the mentioned decline and February's monthly low.
Support levels: 1.2345 1.2300 1.2260
Resistance levels: 1.2425 1.2460 1.2500
USD/JPY Current price: 112.78
View Live Chart for the USD/JPY
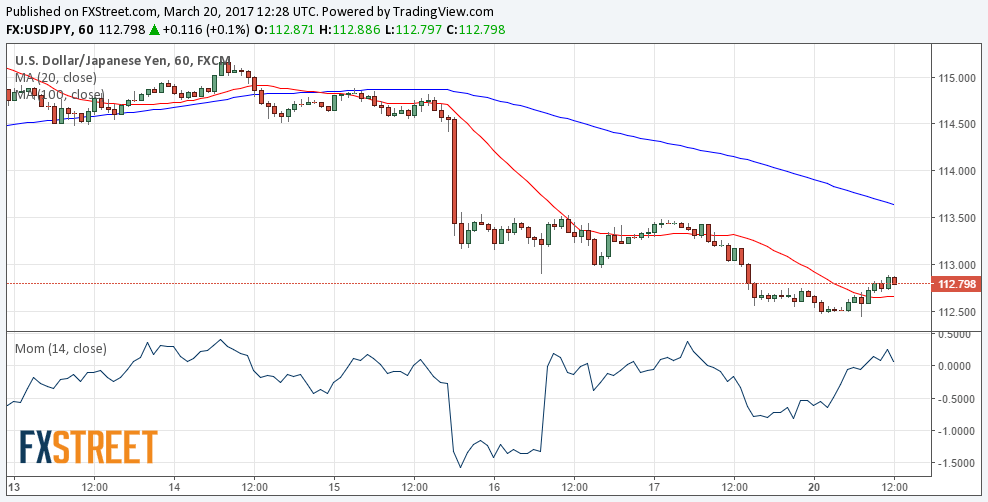
Consolidating near fresh multi-week low. The soft tone in equities and bond yields is keeping the USD/JPY pair confined to a tight range and not far from a fresh multi-week low of 112.45 achieved during Asian trading hours. Contained below 113.00, the 1 hour chart shows that the price is well below bearish moving averages, with the 100 SMA heading sharply lower around 113.60. Technical indicators in the same time frame have lost upward strength after entering positive territory, presenting a neutral stance ahead of the US opening. In the 4 hours chart, the RSI indicator has barely corrected oversold readings before turning flat around 37, whilst the Momentum indicator has corrected within negative territory, but resumed its decline before reaching its mid-line, maintaining the risk towards the downside.
Support levels: 112.50 112.10 111.65
Resistance levels: 113.05 113.50 114.00
AUD/USD Current price: 0.7719
View Live Chart for the AUD/USD
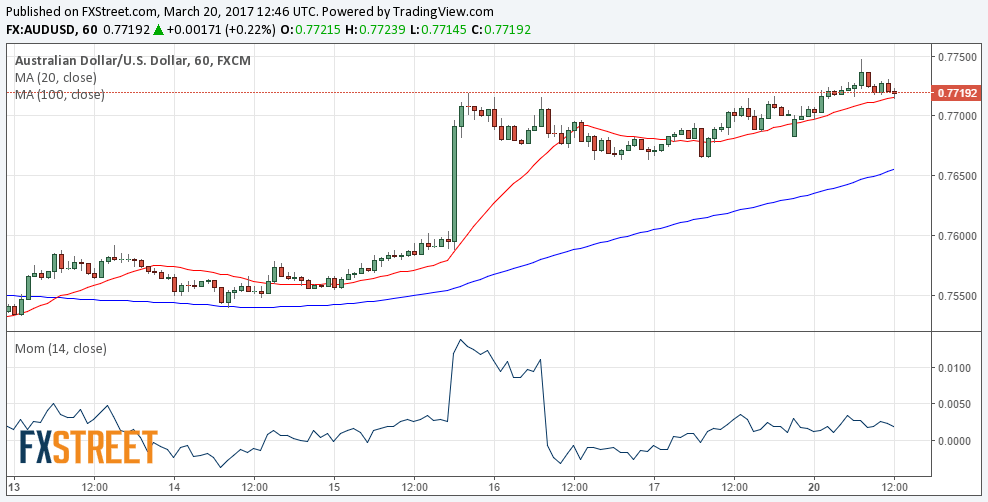
The AUD/USD pair peaked at 0.7747 at the beginning of the day, its highest in t months, underpinned by broad dollar's weakness. The pair retreated from the low, but held above the 0.7700 level, overall maintaining the positive tone. The 1 hour chart shows that the price bounced from a bullish 20 SMA, while technical indicators head nowhere within positive territory. In the 4 hours chart, a strongly bullish 20 SMA extended its advance up to 0.7690, providing an immediate dynamic support, whilst the Momentum indicator has bounced from its 100 level, and the RSI hovers around 63, not enough to support a downward extension.
Support levels: 0.7690 0.7650 0.7610
Resistance levels: 0.7740 0.7770 0.7810
Author

Valeria Bednarik
FXStreet
Valeria Bednarik was born and lives in Buenos Aires, Argentina. Her passion for math and numbers pushed her into studying economics in her younger years.


