EUR/USD Price Forecast: Correcting lower, downside limited

EUR/USD Current price: 1.1386
- EU inflation eased by more than anticipated in May, according to the Harmonized Index of Consumer Prices.
- The focus shifts to United States employment-related data ahead of Friday’s NFP release.
- EUR/USD under near-term selling pressure, downside potential limited.
The EUR/USD pair eases from its weekly peak on Tuesday, trading a handful of pips below the 1.1400 threshold, as the US Dollar (USD) found some footing after edging sharply lower at the beginning of the week. The market sentiment improved just modestly after Monday’s tensions, despite the Organisation for Economic Co-operation and Development (OECD) expressing concerns about global economic growth.
“The global outlook is becoming increasingly challenging. Substantial increases in trade barriers, tighter financial conditions, weakened business and consumer confidence, and elevated policy uncertainty all pose significant risks to growth,” the OECD expressed in its 2025 Economic Outlook.
The Euro (EUR) fell amid the negative sentiment, and regardless encouraging inflation data. The EU Harmonized Index of Consumer Prices (HICP) rose by 1.9% year-on-year (YoY) in May, below the European Central Bank’s (ECB) 2% target. The core annual figure printed at 2.3%, easing from the 2.7% posted in April and below the 2.5% anticipated by market players.
The focus now shifts to the US calendar, as the country will release April Factory Orders and the JOLTS Job Openings report for the same month. The latter will likely gather most of the attention ahead of the release of the Nonfarm Payrolls (NFP) report next Friday.
EUR/USD short-term technical outlook
The EUR/USD pair trades around 1.1380, and the daily chart shows the slide could continue, although the risk of a steeper slide is well-limited. The pair trades above all its moving averages, with a flat 20 Simple Moving Average (SMA) providing support in the 1.1270 price zone. At the same time, the 100 SMA keeps advancing beyond a directionless 200 SMA, both far below the shorter one. Finally, technical indicators turned modestly lower but remain well into positive territory, reflecting the ongoing slide but far from suggesting mounting selling interest.
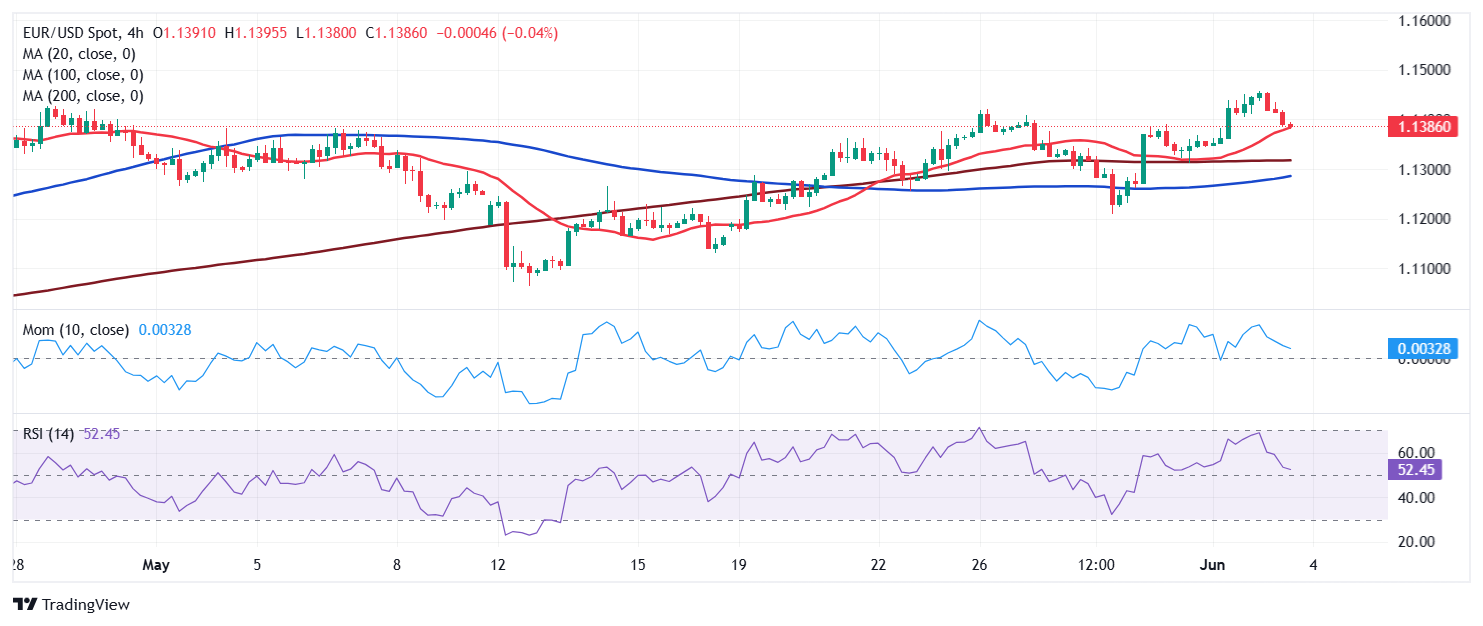
The near-term picture is pretty similar, with EUR/USD aiming to extend its decline, yet with limited downward scope. In the 4-hour chart, the pair is currently battling a bullish 20 SMA, which advances beyond directionless 100 and 200 SMAs. The Momentum indicator turned flat just above its 100 level after correcting overbought conditions, while the Relative Strength Index (RSI) indicator heads south, yet remains above its midline.
Support levels: 1.1330 1.1270 1.1240
Resistance levels: 1.1420 1.1460 1.1505
Premium
You have reached your limit of 3 free articles for this month.
Start your subscription and get access to all our original articles.
Author

Valeria Bednarik
FXStreet
Valeria Bednarik was born and lives in Buenos Aires, Argentina. Her passion for math and numbers pushed her into studying economics in her younger years.


