EUR/USD Price Forecast: Buyers retain control after encouraging US data

EUR/USD Current price: 1.1098
- Escalating trade tensions between Washington and Beijing pressure the US Dollar.
- The US Consumer Price Index came in below expectations, weighing on the USD.
- EUR/USD flirts with monthly highs, bullish strength set to continue.
Markets recovered the optimism on Wednesday, on fresh trade war headlines. The White House announced a 90-day pause on most tariffs announced a week earlier, aimed at bringing countries to the negotiation table. United States (US) President Donald Trump authorized lowering reciprocal tariffs to 10% for all countries not taking countermeasures against the US. Tariffs of 25% previously announced remained the same.
However, the pause did not apply to Beijing. On the contrary, tit-for-tat tariffs between the US and China escalated to unbelievable levels in the last few days, as Trump lifted levies on China to 125% after the latter said it would impose tariffs of 84% on US imports.
Nevertheless, stocks soared and government bond yields recovered, as speculative interest scaled back bets on widespread recessions. The US Dollar (USD), on the other hand, resumed its slide. As a result, EUR/USD flirted with the 1.1100 figure, holding nearby ahead of the release of US first-tier data.
The country published the March Consumer Price Index (CPI), which rose by less than anticipated, leading to another USD leg lower. The annual CPI declined to 2.4% in March from 2.8% in February, also below the expected 2.6%. The core annual figure printed at 2.8%, down from the previous 3.1%. On a monthly basis, inflation was down by 0.1% vs an anticipated 0.1% increase. At the same time, weekly unemployment claims rose by 223K last week, meeting the market’s expectations.
EUR/USD short-term technical outlook
The EUR/USD pair broke through the 1.1100 threshold with US data releases, and nears the April high at 1.1146. From a technical perspective, the daily chart shows EUR/USD could reach higher highs. The pair trades above all its moving averages, with the 20 Simple Moving Average (SMA) gaining upward traction in the 1.0880 region while above the 100 and 200 SMAs. Technical indicators, in the meantime, head firmly north well above their midlines, in line with strong buying interest.
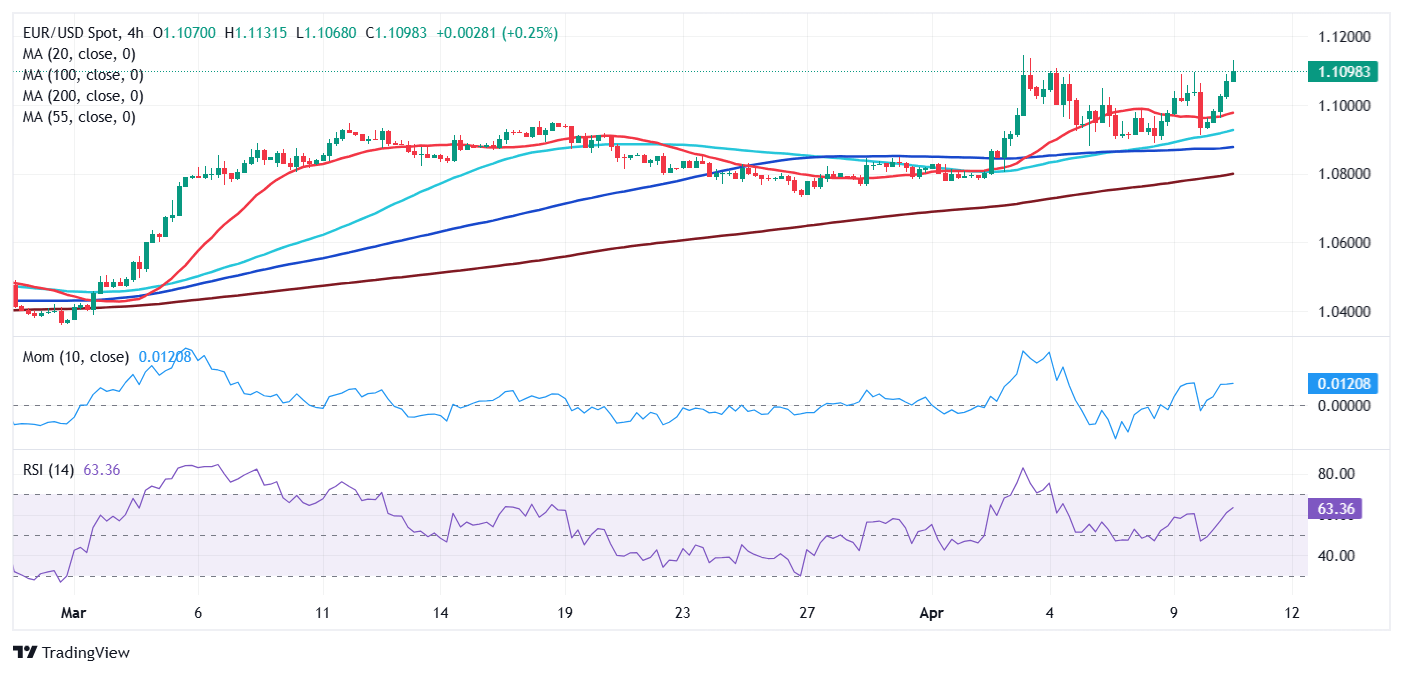
The near-term picture is also bullish. In the 4-hour chart, the EUR/USD pair is heading higher. Technical indicators accelerated north well above their midlines, as the pair extends its advance beyond all moving averages. The 20 SMA is barely up at around 1.0980, while the longer ones stand far below it with limited upward strength.
Support levels: 1.1045 1.1005 1.0970
Resistance levels: 1.1110 1.1145 1.1190
Premium
You have reached your limit of 3 free articles for this month.
Start your subscription and get access to all our original articles.
Author

Valeria Bednarik
FXStreet
Valeria Bednarik was born and lives in Buenos Aires, Argentina. Her passion for math and numbers pushed her into studying economics in her younger years.


