EUR/USD: pressured, 1.0700 critical now

EUR/USD Current price: 1.0725
View Live Chart for the EUR/USD
The EUR/USD pair fell to a fresh 1-week low of 1.0720, its lowest since March 21st, undermined by Wednesday's headlines indicating that the ECB is in no rush to begin tapering its stimulus programs. Also, pressuring the pair was a steady greenback, and disappointing EU data for March. For the whole region, Economic sentiment indicator came in at 107.9, below previous 108.00 and the expected 108.2, whilst consumer confidence remained unchanged at -5. German preliminary March inflation cape slightly below market's expectations, up by 1.6% yearly basis, from previous 2.2%, while month-on-month, it rose by 0.2% from previous 0.6%. In the US, weekly unemployment claims disappointed, reaching 258K against market's expectations of 248K against a previous upwardly revised 261K, but the final revision of Q4 GDP up to 2.1% from previous 2.0%.
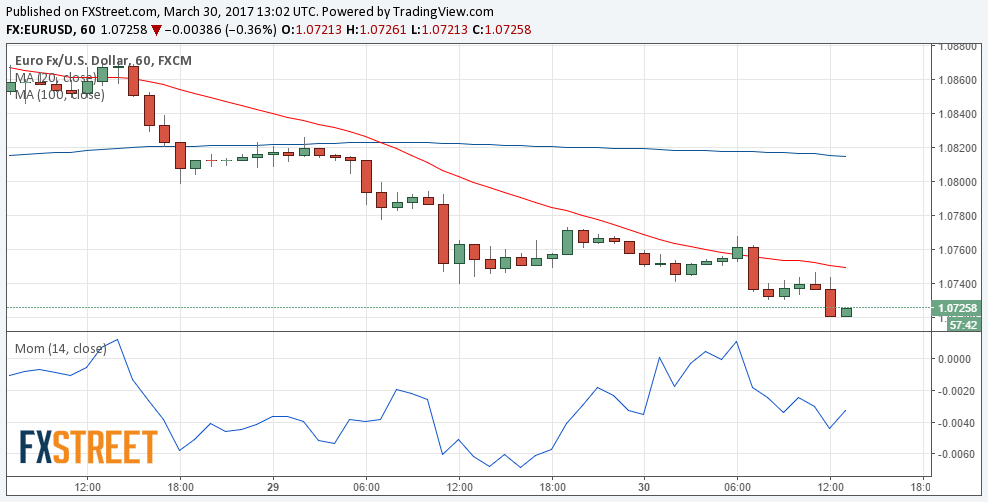
The EUR/USD pair 1 hour chart shows that the price remains near its daily low, contained by a bearish 20 SMA, currently at 1.0750, whilst technical indicators have lost downward strength, but hold near oversold readings. In the 4 hours chart, technical indicators have accelerated their declines within oversold territory, whilst the price is breaking through its 100 SMA, favoring additional declines on a bearish acceleration below the 1.0700 price zone, a strong static support.
Support levels: 1.0700 1.0670 1.0640
Resistance levels: 1.0750 1.0780 1.0825
GBP/USD Current price: 1.2476
View Live Chart for the GBP/USD
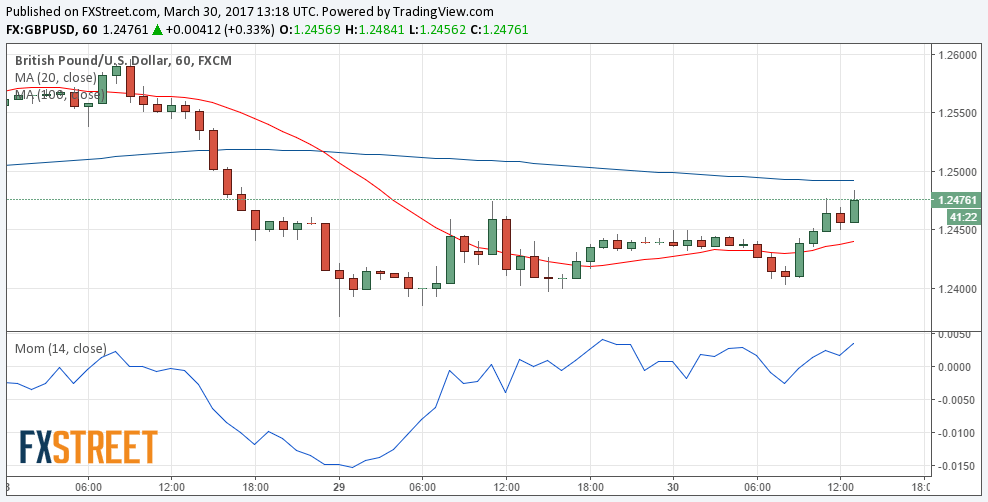
The GBP/USD pair advanced during the European session, standing near a daily high of 1.2484 ahead of Wall Street's opening, with no certain catalyst behind the recovery, but weakness among local equities. The pair is gaining upward momentum after breaking above Wednesday's high, and technical readings in the 1 hour chart are aligned towards the upside, as indicators bounced from their mid-lines, reaching fresh daily highs, whilst the 20 SMA turned north below the current level. In the 4 hours chart, however, the rally is meeting some resistance around a bearish 20 SMA at 1.2490, while technical indicators turned north below their mid-lines, indicating that a break above the mentioned SMA is required to confirm additional gains up to 1.2530, an immediate Fibonacci resistance.
Support levels: 1.2445 1.2400 1.2370
Resistance levels: 1.2490 1.2530 1.2575
USD/JPY Current price: 111.16
View Live Chart for the USD/JPY
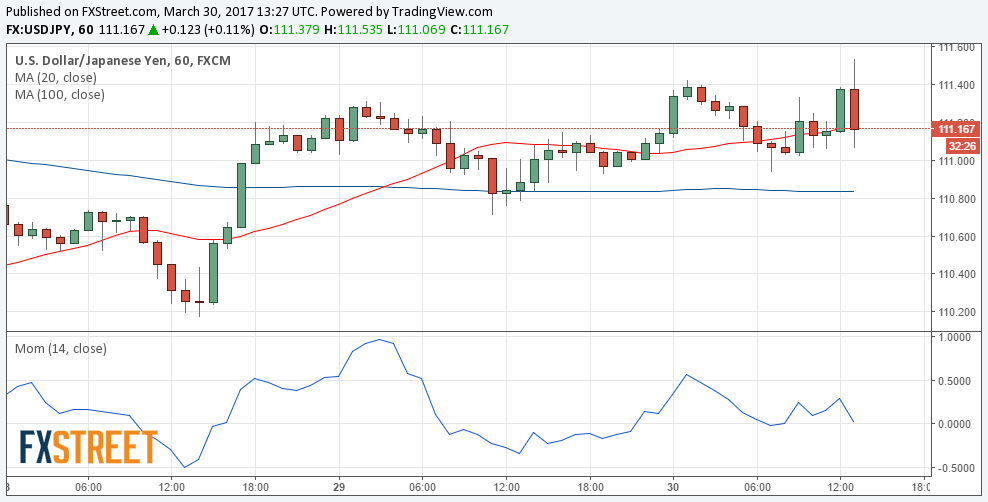
Selling interest keeps capping rallies. The USD/JPY pair consolidated uneventfully around the 111.00 level for most of this Thursday, with a spike up to 111.53 being quickly reverted. The dollar is losing ground after the release of mixed data, with Q4 GDP being revised higher, but unemployment figures disappointing. The upward potential in the pair remains limited by strong selling interest around 111.60, in where the pair bottomed multiple times over the past weeks, and the 1 hour chart shows that the price retreated back below its 200 SMA, whilst technical indicators turned lower and are currently breaking below their mid-lines, indicating that the short term risk remains towards the downside. In the 4 hours chart, the price continues developing below bearish 100 and 200 SMAs, whilst indicators turned modestly lower within positive territory, failing to provide clear directional signs.
Support levels: 111.05 110.70 110.25
Resistance levels: 111.60 112.00 112.45
Author

Valeria Bednarik
FXStreet
Valeria Bednarik was born and lives in Buenos Aires, Argentina. Her passion for math and numbers pushed her into studying economics in her younger years.


