EUR/USD: lower in range ahead of Trump

EUR/USD Current price: 1.0629
View Live Chart for the EUR/USD
Following a short lived decline early Asia, the American dollar trades marginally higher across the board, holding on to intraday gains ahead of Wall Street's opening, although action is quite limited across the board, as the market waits for Trump's inauguration speech later today. Early Europe, Germany released its December PPI figures, which matched market's expectations, failing to trigger a market reaction.
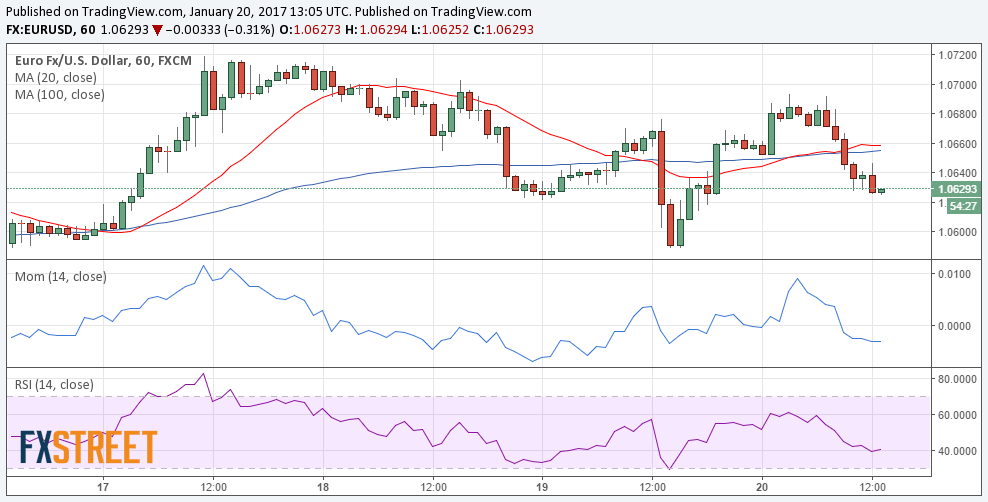
The EUR/USD pair retreated from a daily high of 1.0693 and trades near a daily low of 1.0624, overall bearish in the short term, as in the 1 hour chart, technical indicators present modest downward slopes within negative territory, whilst the price struggles around the 200 SMA, after breaking below the 20 and 100 ones. In the 4 hours chart, the price has broken below its 20 SMA at the beginning of the London session, while technical indicators stand well below their mid-lines, although with limited downward strength. The pair can extend its decline down to 1.0565 later on the day, but it will take a weekly close below it to put the greenback back on the bullish track.
Support levels: 1.0600 1.0565 1.0510
Resistance levels: 1.0650 1.0710 1.0745
GBP/USD Current price: 1.2275
View Live Chart for the GBP/USD
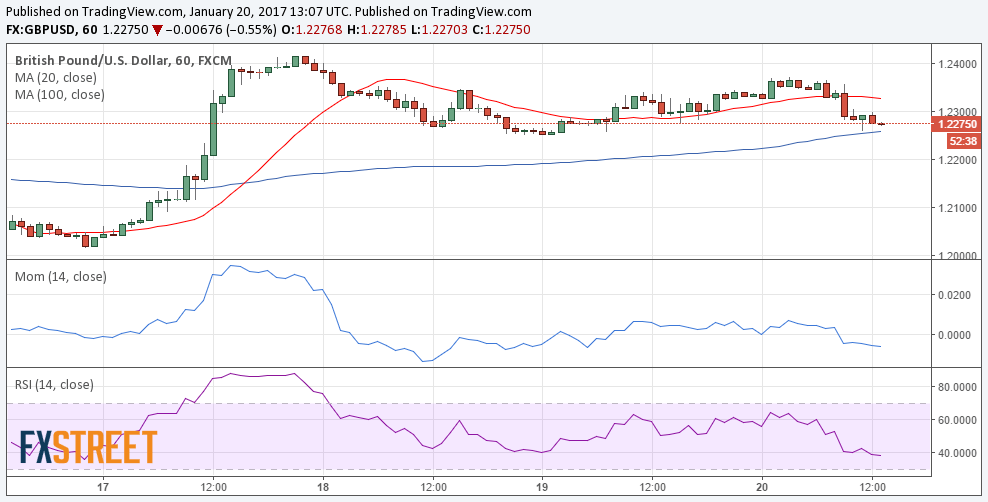
The GBP/USD pair shed over 100 pips this Friday, retreating from a daily high of 1.2371 after UK Retail Sales for December disappointed big. Sales fell by 1.9% in the month, when compared to November, sending the year-on-year reading down to 4.3% from an expected 7.2% advance. Core figures ex-fuel, also disappointed big, down by 2.0% monthly basis, and up by 4.9% when compared to a year before. The GBP/USD pair trades near a daily low of 1.2260, and the 1 hour chart shows that the price is below a modestly bearish 20 SMA, whilst technical indicators are extending their declines within bearish territory, supporting additional declines sub-1.2200, on a break below the mentioned daily low. In the 4 hours chart, the price has broken below its 20 SMA for the first time since Theresa May's speech, but the downward strength seems limited, as the Momentum indicator holds flat below its 100 level, whilst the RSI heads lower but around 51, not enough to confirm further declines.
Support levels: 1.2260 1.2230 1.2190
Resistance levels: 1.2310 1.2345 1.2390
USD/JPY Current price: 115.16
View Live Chart for the USD/JPY
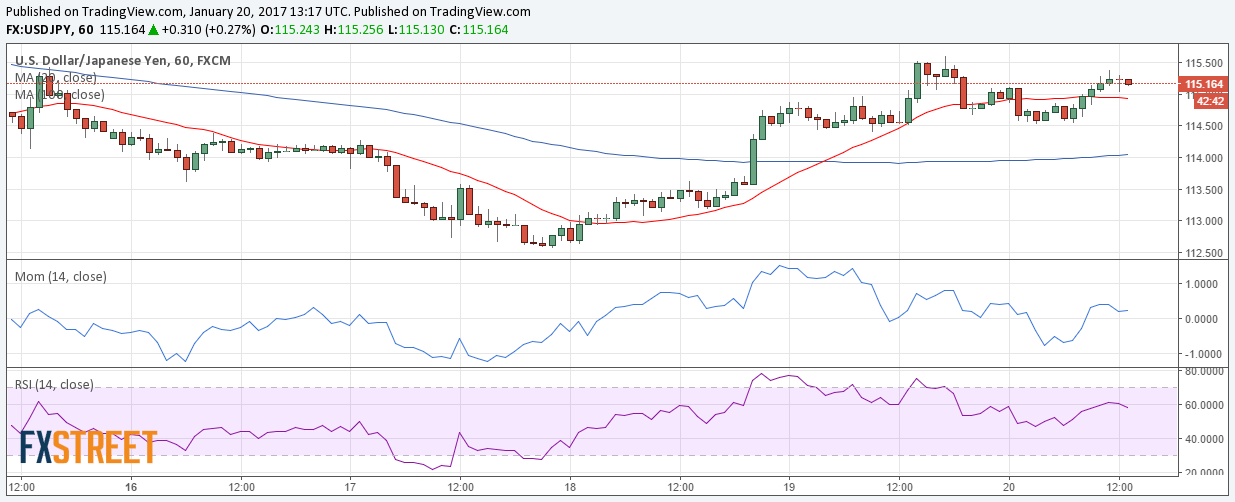
Bullish only above 115.60. The USD/JPY pair retreated modestly during the Asian session, but held above 114.50, the 23.6% retracement of the November/December rally, recovering the 115.00 level and holding above it ahead of the US opening, although easing from a daily high of 115.38. Despite US yields hold on to Thursday's gains, the pair retreats ahead of US opening, and the 1 hour chart shows that the 100 SMA heads higher a few pips above the mentioned Fibonacci support, whilst technical indicators keep retreating from overbought readings, gaining bearish momentum, but within positive territory. In the 4 hours chart, a bearish 100 SMA caps the upside around 115.60, whilst technical indicators pull back from overbought readings, suggesting the recovery may extend only on a break above this last.
Support levels: 114.90 114.50 114.10
Resistance levels: 115.60 116.00 116.45
AUD/USD Current price: 0.7535
View Live Chart for the AUD/USD
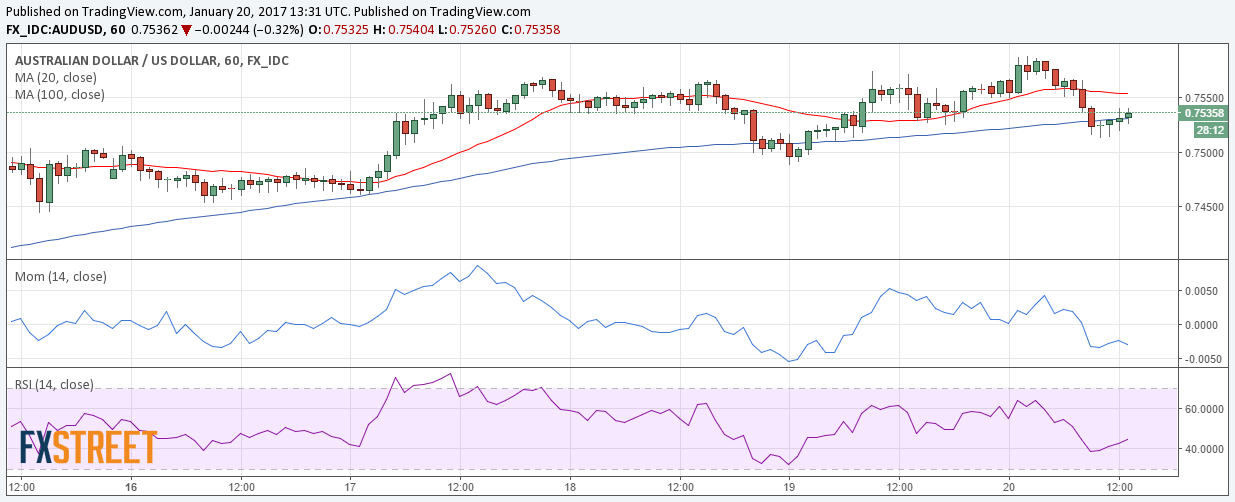
The AUD/USD pair fell down to 07517 this Friday, undermined by lower commodities prices overnight, alongside with a broadly stronger greenback. The pair broke below the base of an ascendant channel that led price action ever since the year started, although the price is completing a pullback towards the base of the figure at 0.7550. Technically, the 1 hour chart shows that the price is below a bearish 20 SMA, a few pips above the mentioned line, whilst technical indicators hover within bearish territory with no clear directional strength. In the 4 hours chart, the price is a below its 20 SMA, also a few pips above the broken trend line, whilst technical indicators hover within neutral territory, indicating a limited bearish potential for this Friday.
Support levels: 0.7490 0.7450 0.7410
Resistance levels: 0.7560 0.7600 0.7640
Author

Valeria Bednarik
FXStreet
Valeria Bednarik was born and lives in Buenos Aires, Argentina. Her passion for math and numbers pushed her into studying economics in her younger years.


