EUR/USD has solid support but it may hesitate on the way up – Confluence Detector

EUR/USD is trading around the round number of 1.1200, looking steady despite the turmoil in markets. What's next? Bears are stuck but bulls are not looking much better.
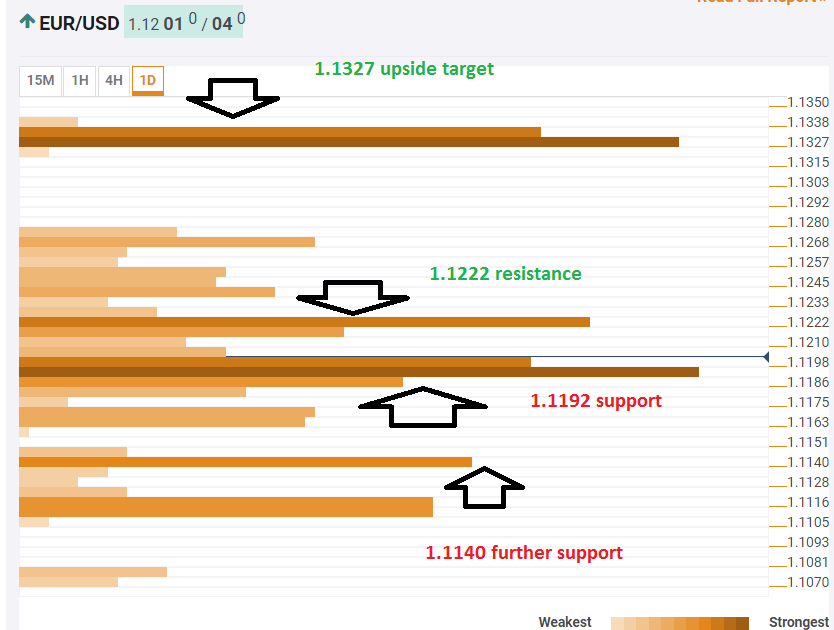
The Technical Confluences Indicator shows that the world's most popular currency pair enjoys support at 1.1192 where we see the convergence of the Simple Moving Average 50-4h, the SMA 5-4h, the Bollinger Band 4h-Middle, the BB 15min-Lower, the BB 1h-Middle, the SMA 50-15m, the SMA 5-1d, the Fibonacci 38.2% one-month, and the SMA 10-4h.
If it slips below this point, the next significant support line awaits at 1.1140 which is the confluence of the previous weekly low and the Pivot Point one-week Support 1.
Rising is not that straightforward either. At 1.1222, EUR/USD faces the Fibonacci 38.2% one-week, the PP 1d-R1, and others.
In case the bulls take over, EUR/USD will put its eyes on 1.1327 which is a juncture of lines including the PP 1m-R1, the BB 1d-Upper, the previous monthly high, the SMA 100-1d, and the PP 1w-R2.
Here is how it looks on the tool:
Confluence Detector
The Confluence Detector finds exciting opportunities using Technical Confluences. The TC is a tool to locate and point out those price levels where there is a congestion of indicators, moving averages, Fibonacci levels, Pivot Points, etc. Knowing where these congestion points are located is very useful for the trader, and can be used as a basis for different strategies.
This tool assigns a certain amount of “weight” to each indicator, and this “weight” can influence adjacents price levels. These weightings mean that one price level without any indicator or moving average but under the influence of two “strongly weighted” levels accumulate more resistance than their neighbors. In these cases, the tool signals resistance in apparently empty areas.
Author

Yohay Elam
FXStreet
Yohay is in Forex since 2008 when he founded Forex Crunch, a blog crafted in his free time that turned into a fully-fledged currency website later sold to Finixio.


