|

EUR/USD gains may run into a wall – Confluence Detector

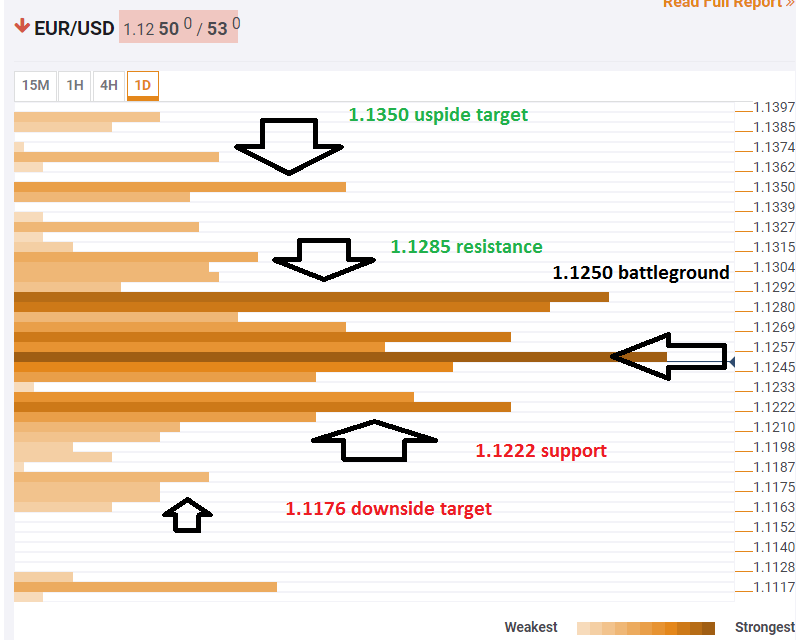
EUR/USD enjoyed a recovery of sorts during the Easter weekend, reaching 1.1250 and staying away from 1.1200. What's next? The next moves to the upside may be limited. 

The Technical Confluences Indicator shows that the pair is struggling around 1.1250 where we see the convergence of the Bollinger Band 15min-Lower, the Fibonacci 61.8% one-day, the Fibonacci 23.6% one-week, the previous 1h-low, the BB 1d-Middle, the Simple Moving Average 5-15m, and more.

The next cap is quite close. At 1.1285, EUR/USD faces the juncture of the Pivot Point one-day Resistance 2, the Fibonacci 61.8% one-week, the BB 4h-Upper, the SMA 200-1h, and the Fibonacci 38.2% one-month. 

Further up, 1.1350 is the confluence of the Fibonacci 61.8% and one-month, the SMA 100-1d. 

Looking down, 1.1222 is the juncture of lines including the previous yearly low, the Fibonacci 161.8% one-day, the BB 4h-Lower, the PP 1d-S2, and the previous weekly low.

Further down, 1.1176 is where 2019 low meets the PP 1w-S2.

Here is how it looks on the tool:

EUR USD technical confluence April 23 2019

Confluence Detector

The Confluence Detector finds exciting opportunities using Technical Confluences. The TC is a tool to locate and point out those price levels where there is a congestion of indicators, moving averages, Fibonacci levels, Pivot Points, etc. Knowing where these congestion points are located is very useful for the trader, and can be used as a basis for different strategies.

This tool assigns a certain amount of “weight” to each indicator, and this “weight” can influence adjacents price levels. These weightings mean that one price level without any indicator or moving average but under the influence of two “strongly weighted” levels accumulate more resistance than their neighbors. In these cases, the tool signals resistance in apparently empty areas.

Learn more about Technical Confluence

Author

Yohay Elam

Yohay Elam

FXStreet

Yohay is in Forex since 2008 when he founded Forex Crunch, a blog crafted in his free time that turned into a fully-fledged currency website later sold to Finixio.

More from Yohay Elam
Share:

Markets move fast. We move first.

Orange Juice Newsletter brings you expert driven insights - not headlines. Every day on your inbox.

By subscribing you agree to our Terms and conditions.

Editor's Picks

EUR/USD off three-month highs, holds near 1.1800 on softer US Dollar

EUR/USD consolidates gains below 1.1800 in the European trading hours on Wednesday. A broadly subdued US Dollar continues to underpin the pair amid quiet markets and thin liquidity conditions on Christmas Eve. 

GBP/USD keeps range around 1.3500 amid quiet markets

GBP/USD keeps its range trade intact at around 1.3500 in the European session on Wednesday. The Pound Sterling holds the upper hand over the US Dollar amid pre-Christmas light trading as traders turn to sidelines heading into the holiday season. 

Gold retreats from record highs amid profit-taking on Christmas Eve

Gold retreats following the move higher to the $4,525 area, or a fresh all-time peak, though the downside remains limited amid a bullish fundamental backdrop. The US Dollar selling bias remains unabated on the back of dovish Fed expectations, which continues to act as a tailwind for the bullion amid persistent geopolitical risks.

Shiba Inu's bears tighten grip, aiming for yearly lows

Shiba Inu price remains under pressure, trading below $0.000070 on Wednesday as bearish momentum continues to dominate the broader crypto market. On-chain and derivatives data further support the bearish sentiment, while technical analysis suggests a deeper correction targeting the yearly lows.

Economic outlook 2026-2027 in advanced countries: Solidity test

After a year marked by global economic resilience and ending on a note of optimism, 2026 looks promising and could be a year of solid economic performance. In our baseline scenario, we expect most of the supportive factors at work in 2025 to continue to play a role in 2026.

Stellar Price Forecast: XLM slips below $0.22 as bearish momentum builds

Stellar (XLM) price is trading below $0.22 at the time of writing on Wednesday after failing to close above the key resistance earlier this week. Bearish momentum continues to strengthen, with open interest falling and short bets rising.