EUR/USD Forecast: Holding above 0.9700, but not for long

EUR/USD Current Price: 0.9716
- Market players believe the US Federal Reserve will keep delivering 75 bps rate hikes.
- US Consumer Price Index to be out on Wednesday will be a make it or break it.
- EUR/USD is at risk of retesting the multi-year low posted in September at 0.9535.
The EUR/USD pair finished Monday just above the 0.9700 level, extending its decline for the fourth consecutive day. Risk aversion took over financial markets amid renewed growth-related concerns, exacerbated by mounting tensions between Europe and Russia and speculation the US Federal Reserve will keep hiking rates by 75 bps per meeting.
The upbeat US Nonfarm Payroll report released on Friday boosted the greenback as a healthy job sector allows the Federal Reserve to maintain the aggressive pace of quantitative tightening. Also, the week started with Russia launching widespread attacks on Ukraine, escalating the conflict.
The dismal market mood was exacerbated by EU data, as Sentix Investor Confidence plummeted to -38.3 in October from -31.8 in the previous month. According to the official report, “economic data for Germany signal a catastrophic state of the economic condition.” Furthermore, the report noted that there is little hope for improvement, given the outlook of the global situation. The EUR enjoyed some temporal demand ahead of the European close on news suggesting Germany has reportedly agreed to back joint EU debt to tackle the energy crisis, although it was later denied by the German government.
The macroeconomic calendar for these two economies will remain light on Tuesday, focusing this week on the FOMC Meeting Minutes scheduled for Wednesday and the US Consumer Price Index to be out on Thursday.
EUR/USD short-term technical outlook
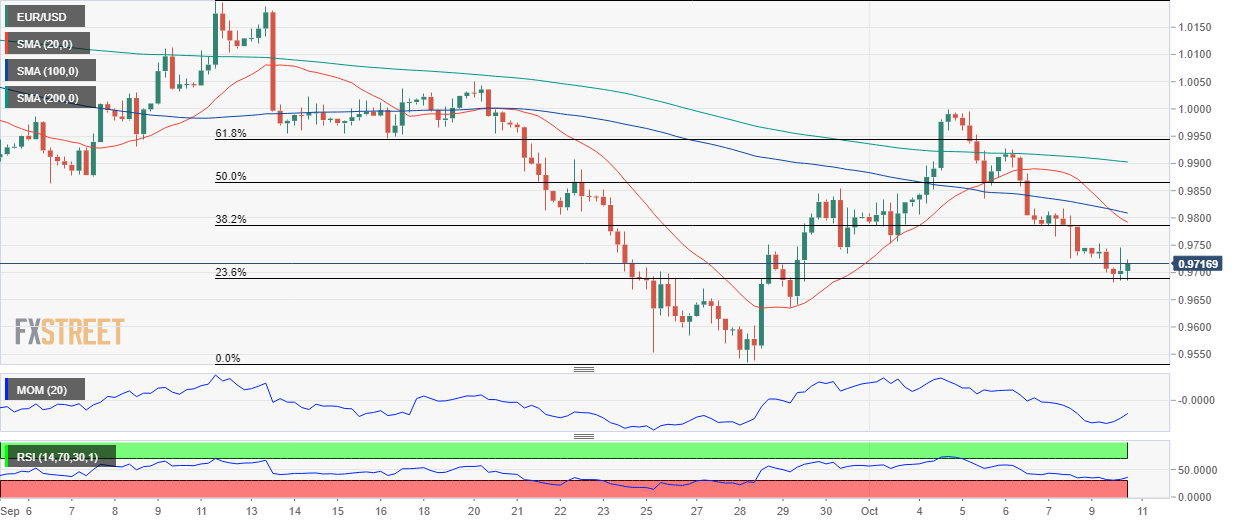
The EUR/USD pair briefly pierced a Fibonacci support level, the 23.6% Fibonacci retracement of the 1.0197/0.9535 daily slide at 0.9690, but settled above it. The daily chart shows that the risk skews to the downside, as the pair is now below all of its moving averages, with the 20 Simple Moving Average (SMA) gaining bearish traction at around 0.9830. Technical indicators, in the meantime, remain within negative levels and at their daily lows, although they are losing their downward strength.
The 4-hour chart shows that the 20 SMA has extended its decline and crossed below the 100 SMA, both above the current level, suggesting increased selling interest. Technical indicators, on the other hand, have bounced modestly from near oversold levels, although lacking strength enough to confirm a bullish continuation. The 38.2% retracement of the aforementioned rally comes at 0.9790, the level to beat for more near-term gains.
Support levels: 0.9680 0.9635 0.9585
Resistance levels: 0.9750 0.9790 0.9835
Author

Valeria Bednarik
FXStreet
Valeria Bednarik was born and lives in Buenos Aires, Argentina. Her passion for math and numbers pushed her into studying economics in her younger years.
















