The DeCarley perspective: Corn futures were rocked by WASDE- now what?

Corn futures were rocked by WASDE- now what?
Last Friday, the grain markets were rocked by a surprise WASDE (World Agricultural Supply and Demand Estimates) report issued by the USDA (U.S. Department of Agriculture). On October 9th, the markets learned the USDA had revised its corn yield to 181.2 bushels per acre, up from 178.5 last month and below the recognized trendline yield of 183. Going into the report, trade estimates were even lower at 177.6. If true, this USDA revision pushes corn production to the second-largest crop on record and increases both domestic and global stocks well beyond previous expectations.
Not everyone trusts the USDA's numbers; most market participants relied on the Pro Farmer Crop Tour estimate of 173.2 bushels per acre. It is worth noting that the Pro Farmer Crop Tour consists of over a hundred volunteers, most of whom benefit from higher commodity prices. Further, farmers are intelligent; they know that putting “No Trespassing” signs on their property forces tour participants to skip that farm during assessment. Thus, farmers with healthy yields might be tempted to put up such a sign. I am not questioning integrity or the process, but human nature is a heck of a drug. Lastly, another testament to farmers' intelligence: they consistently get better at what they do. A little adverse weather, planting, or harvest delays don’t devastate crops the way they used to. For now, we can only wait for the results rather than controversial projections.
Once again, the higher dollar isn’t getting the attention or credit it deserves for its market ripple effects. While the world is focused on corn supply, it is worth monitoring demand. The dollar index has moved from a low of 95.00 in January to just under 103.00 this week. This move is large enough to affect commodity producers in the US. A stronger dollar makes our grain less competitively priced on the world stage, which can reduce demand. If there aren’t enough buyers, a handful of bushels per acre in corn yield matters less. Over the last 30 days, the US dollar and corn futures have moved in opposite directions 85% of the time, and the greenback likely shares responsibility for the corn sell-off with the WASDE report. The market was willing to ignore currency fluctuations, believing yields would make up for it.
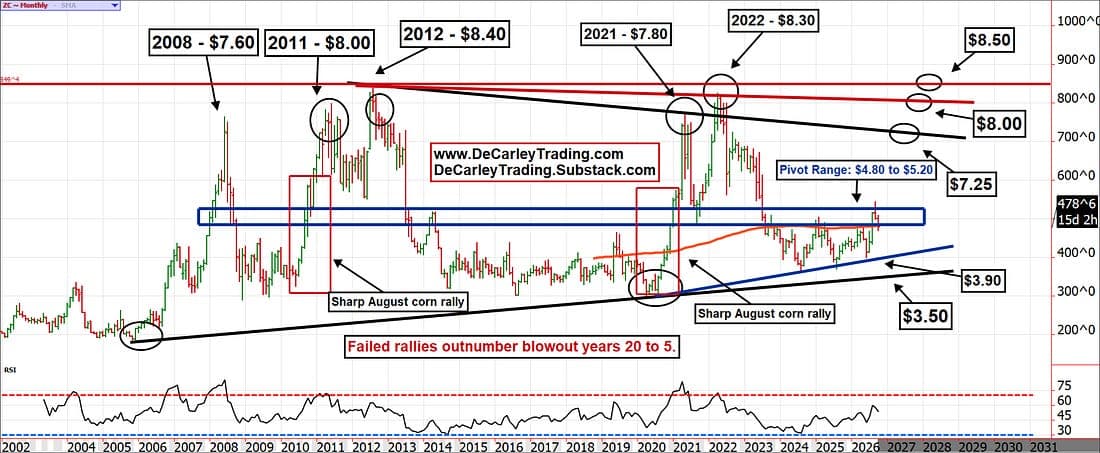
Over the last two decades, we’ve seen corn rally into its pivot zone ($4.80 to $5.20) six times. On these six occasions, corn broke higher sharply three times and failed the other three. The three successful rallies coincided with a bull market in crude oil. Further, we have never seen the market fall above or below this zone and then continue sharply in the breakout direction. Last month, front-month corn futures surpassed $5.20 and have now poked below $4.80. This leaves chartists scratching their heads. Will we hold $4.80 and continue the bull run, or are we heading much lower? We don’t know, but the odds favor $5.20 as a ceiling.
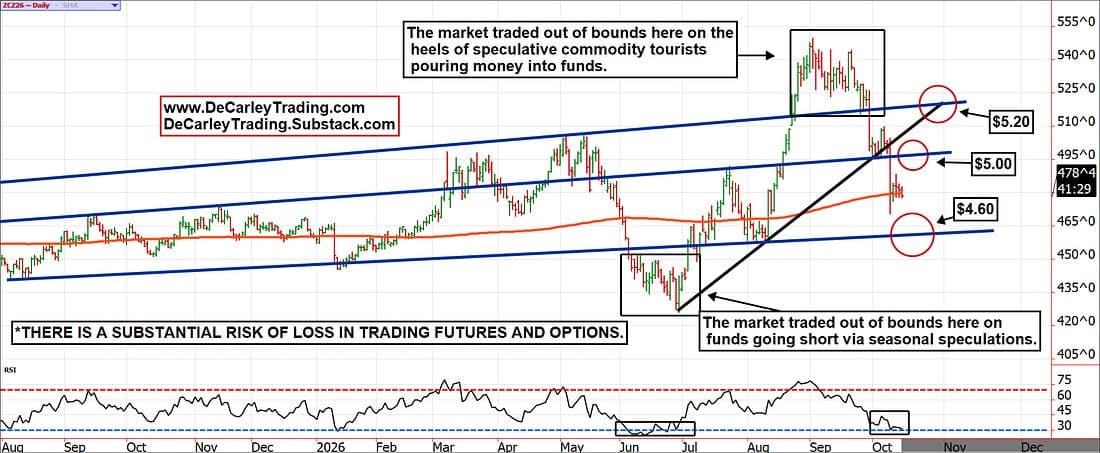
Looking to the daily chart for guidance, the selling has stopped, and the market is consolidating at the 200-day moving average near $4.80. You probably recall that this is the same figure on the lower end of the pivot range we pointed out on the monthly chart. If you are a bull, you don’t want to see prices failing to hold this level. That would likely be the nail in the coffin of the bull market. $4.60 is the next support area, with the low $4.00s in play on continued fund liquidation. If $4.80 holds, we believe the market will want to retest the breakdown levels of $5.00 and $5.20ish, but we don’t expect a runaway bull market. Particularly because funds are still net long and likely won’t have the buying power to move the needle above the natural trading range ($5.20 to $4.60).
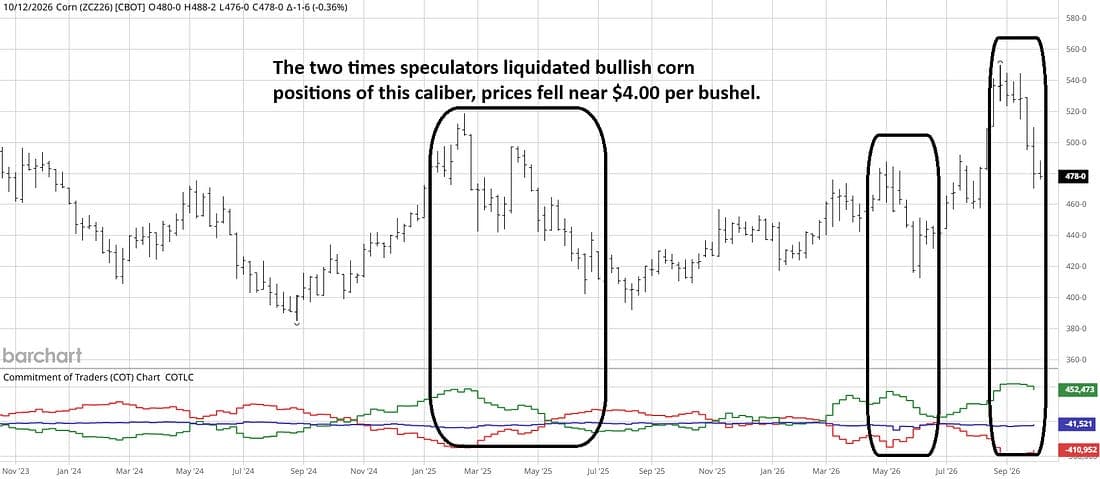
The latest COT Report (Commitments of Traders) suggests futures speculators are holding one of the largest net-long positions in history. However, we have seen substantial liquidation since the last measurement date, which isn’t visible in the latest figures or this chart. We suspect net longs were likely trimmed from about 525,000 to somewhere around 350,000 to 400,000. Of course, my guess could be off, but even if it is 250,000 net longs, we are still only halfway to getting back to neutral or, gulp, net short.
As a producer advocate, I hate that we live in a world where bandwagon speculators play a substantial role in price discovery in the short run (in the long run fundamentals matter). As I've said before in the media and in this newsletter, when trends get pushed out of bounds in either direction, the producer is often left holding the bag. Yet the alternative, a world without market liquidity to allow proper hedging, would be even worse, in my view.
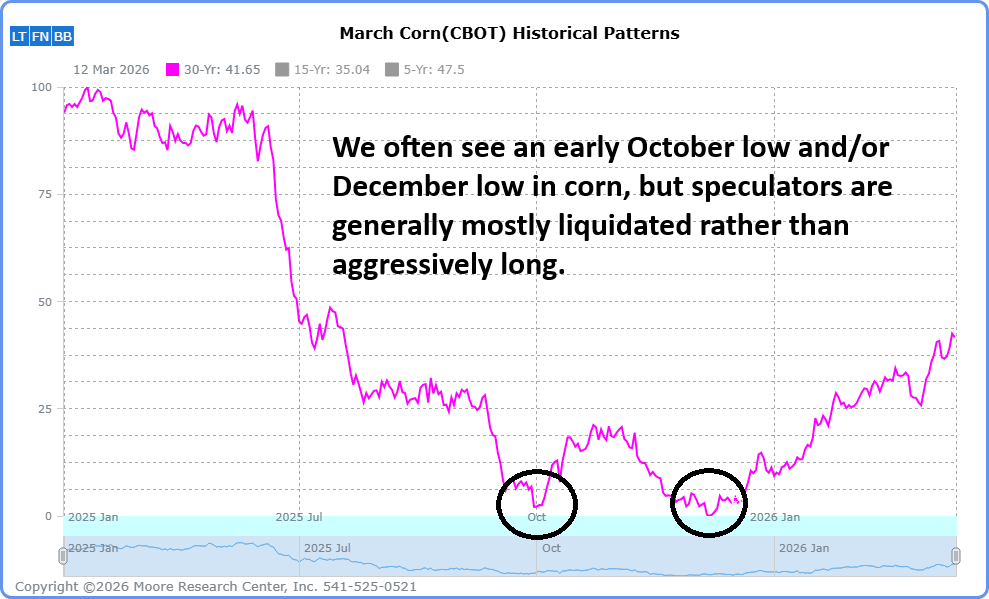
Calling this an unusual year is an understatement. Normally, we come into the fall with funds and speculators holding bearish or neutral positions after seasonal selling in anticipation of the annual harvest supply glut. As a result, prices tend to hit their lowest point in early October, when selling often dries up and produces an October rally, which is often followed by a more permanent low in December. However, given that we're entering seasonal lows with speculators long and prices high, we might see a delayed, more dramatic harvest low, or the usual fall rally followed by a more significant low in December. Our crystal ball doesn’t offer a perfect glimpse into the future, but seasonals suggest any rally from here would likely be temporary.
In summary, we believe dip buyers, seasonality, and USDA skeptics will support the market in the short run. But in the long run, it is hard to imagine a world where speculators aren’t forced to unwind their already aggressive long positions. If you are inclined to play the upside, do it with limited risk and be prepared to take profits near $5.00 or $5.20. If you are inclined to play the downside, look for better entries at the aforementioned $5.00 to $5.20 levels. If you are worried about missing the downside move, you can always buy puts; they are relatively cheap, and once the snowball starts rolling downhill under $4.80, it will likely be difficult to stop.
*There is a substantial risk of loss in trading futures and options. There are no guarantees in speculation; most people lose money trading commodities. Past performance is not indicative of future results. Seasonality is already factored into current prices, any references to such does not infer certainty in future price action
These recommendations are a solicitation for entering into derivatives transactions. All known news and events have already been factored into the price of the underlying derivatives discussed. From time to time persons affiliated with Zaner, or its associated companies, may have positions in recommended and other derivatives.
Author

Carley Garner
DeCarley Trading
Carley Garner is an experienced commodity broker with DeCarley Trading, a division of Zaner, in Las Vegas, Nevada. She is also the author of multiple books including, “Higher Probability Commodity Trading” and “A Trader's First Book on Commodities”.

















