EUR/USD Forecast: Bears take control, aim for another leg south

EUR/USD Current Price: 1.0820
- The EU Harmonized Index of Consumer Prices was downwardly revised to 0.6% MoM in April.
- The market mood is sour despite renewed optimism about a US debt-ceiling deal.
- EUR/USD accelerates its slide and aims to pierce the 1.0800 threshold.
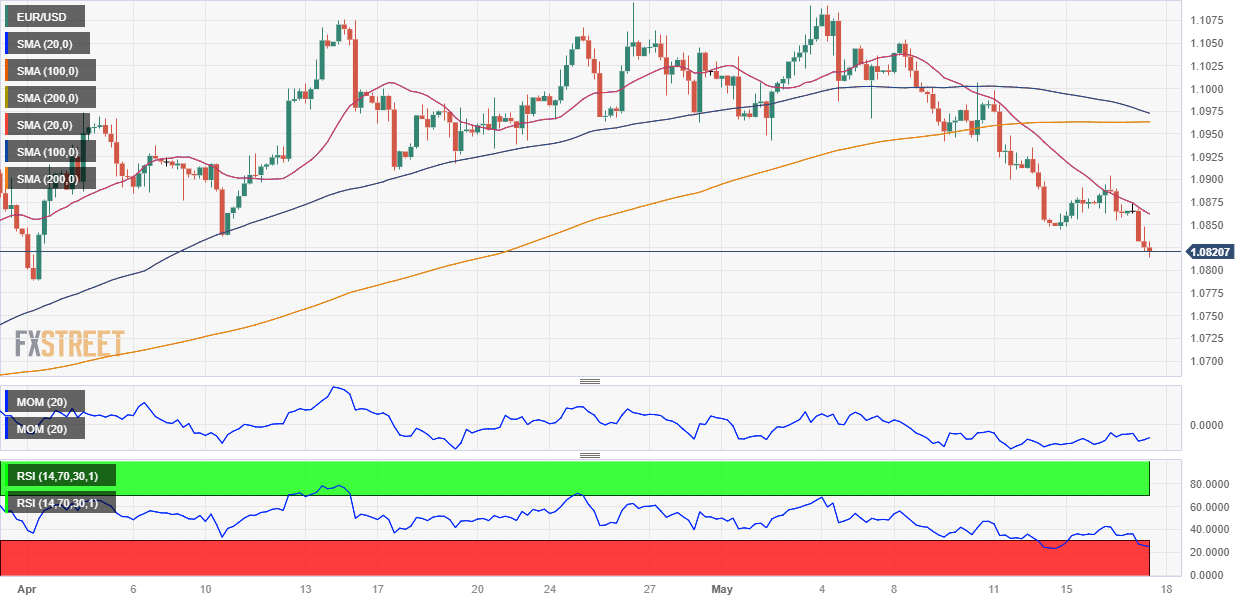
The EUR/USD pair plummeted during the European session to a fresh one-month low of 1.0813, holding nearby as American traders arrive at their desks. The US Dollar appreciated as the risk-off mood persists, despite encouraging news from the United States (US) about the debt ceiling extension. Late on Tuesday, President Joe Biden and top lawmakers met to discuss an agreement and said a deal could be reached by the end of the week.
Stock markets remain choppy, with European indexes mixed yet little changed for the day. US futures, in the meantime, aim to open with gains. At the same time, government bond yields pared gains, and hover around Tuesday's closing levels, failing to provide fresh directional clues.
Meanwhile, mixed comments from European Central Bank (ECB) officials undermine demand for the Euro. On the one hand, Vice President Luis de Guindos noted over the weekend that interest rate hikes are in their final stretch. He also warned that higher borrowing costs could put stress on banks' asset quality, even if indicators so far remain healthy. On the other hand, Bank of Spain's Governor Pablo Hernandez de Cos said on Wednesday that "the persistence of higher inflation would slow the recovery and would very likely lead to further tightening in the euro area." Most officials agree a couple more rate hikes remain on the docket, although the general belief is that it won't be larger than 25 basis points (bps) amid the fragility of the banking system.
Data-wise, the Eurozone published the final estimate of the April Harmonized Index of Consumer Prices (HICP), which was confirmed at 7% YoY. The monthly reading, however, was downwardly revised to 0.6%. The US released April Building Permits, down 1.5% MoM, and Housing Starts for the same month, up 2.2%.
EUR/USD short-term technical outlook
The EUR/USD pair trades near the aforementioned low, and the daily chart hints at further slides ahead. The pair moved further below a bearish 20 Simple Moving Average (SMA), which stands at around 1.0970. At the same time, the pair approaches a mildly bullish 100 SMA at 1.0805. A break below the latter should exacerbate selling interest. Finally, technical indicators head firmly south within negative levels, anticipating another leg lower.
In the near term, and according to the 4-hour chart, the risk also skews to the downside. A bearish 20 SMA rejects recovery attempts while accelerating its decline well below the longer ones. The Momentum indicator heads lower within negative levels, while the Relative Strength Index (RSI) partially lost its downward strength but holds at around 28. The main bearish target on further declines is 1.0745, the 61.8% Fibonacci retracement of the 2022 yearly slump.
Support levels: 1.0800 1.0745 1.0700
Resistance levels: 1.0850 1.0895 1.0940
Author

Valeria Bednarik
FXStreet
Valeria Bednarik was born and lives in Buenos Aires, Argentina. Her passion for math and numbers pushed her into studying economics in her younger years.

















