EUR/USD battle clusters lines clearly drawn ahead of the NFP — Confluence Detector


The Technical Confluences Indicator shows that the battle lines are well-defined toward the all-important release of the US Non-Farm Payrolls.

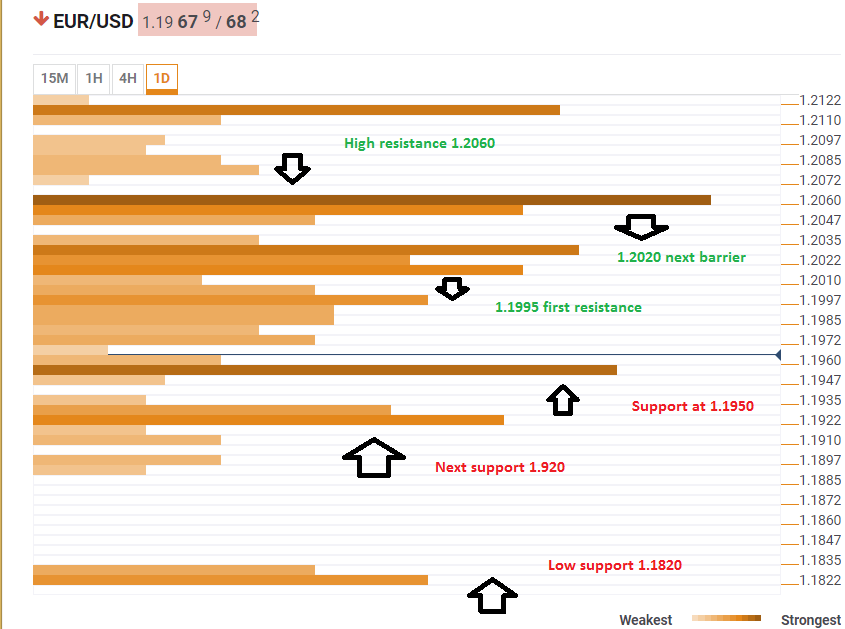
A congestion of support lines awaits around $1.1950 with the one-day High, the Bolinger Band one-day Lower, and the Pivot Point one-day Support 1. Further support is at $1.1920 which sees the confluence of the Pivot Point one-day S2 and the Pivot Point one-week S2. A break below this level opens the door all the way to $1.1820 which is the one-month S2. 

Looking up, the pair faces massive resistance with the first notable confluence around $1.1995 which is the meeting point of the Fibonacci 23.6% one-day, the 4h high, the Bolinger Band 1h-middle and the BB 15m-Upper. $1.2020 is the clustering of the Pivot Point one-week S1 and the Simple Moving Average-5 one-day. Even higher, $1.2060 is the confluence of the one-month low and the one-week low.

Tension is mounting towards the all-important event. See the preview: Employment data not expected to impress

Here is how it looks on the tool:

EUR USD Confluence technical levels May 4 2018

Confluence Detector

The Confluence Detector finds exciting opportunities using Technical Confluences. The TC is a tool to locate and point out those price levels where there is a congestion of indicators, moving averages, Fibonacci levels, Pivot Points, etc. Knowing where these congestion points are located is very useful for the trader, and can be used as a basis for different strategies.

This tool assigns a certain amount of “weight” to each indicator, and this “weight” can influence adjacents price levels. This means that one price level without any indicator or moving average but under the influence of two “strongly weighted” levels accumulate more resistance than their neighbors. In these cases, the tool signals resistance in apparently empty areas.

Learn more about Technical Confluence

Information on these pages contains forward-looking statements that involve risks and uncertainties. Markets and instruments profiled on this page are for informational purposes only and should not in any way come across as a recommendation to buy or sell in these assets. You should do your own thorough research before making any investment decisions. FXStreet does not in any way guarantee that this information is free from mistakes, errors, or material misstatements. It also does not guarantee that this information is of a timely nature. Investing in Open Markets involves a great deal of risk, including the loss of all or a portion of your investment, as well as emotional distress. All risks, losses and costs associated with investing, including total loss of principal, are your responsibility. The views and opinions expressed in this article are those of the authors and do not necessarily reflect the official policy or position of FXStreet nor its advertisers. The author will not be held responsible for information that is found at the end of links posted on this page.

If not otherwise explicitly mentioned in the body of the article, at the time of writing, the author has no position in any stock mentioned in this article and no business relationship with any company mentioned. The author has not received compensation for writing this article, other than from FXStreet.

FXStreet and the author do not provide personalized recommendations. The author makes no representations as to the accuracy, completeness, or suitability of this information. FXStreet and the author will not be liable for any errors, omissions or any losses, injuries or damages arising from this information and its display or use. Errors and omissions excepted.

The author and FXStreet are not registered investment advisors and nothing in this article is intended to be investment advice.

Recommended Content


Recommended Content

Editors’ Picks

AUD/USD: Further losses retarget the 200-day SMA

AUD/USD: Further losses retarget the 200-day SMA

Further gains in the greenback and a bearish performance of the commodity complex bolstered the continuation of the selling pressure in AUD/USD, which this time revisited three-day lows near 0.6560.

AUD/USD News

EUR/USD: Further weakness remains on the cards

EUR/USD: Further weakness remains on the cards

EUR/USD added to Tuesday’s pullback and retested the 1.0730 region on the back of the persistent recovery in the Greenback, always against the backdrop of the resurgence of the Fed-ECB monetary policy divergence.

EUR/USD News

Gold flirts with $2,320 as USD demand losses steam

Gold flirts with $2,320 as USD demand losses steam

Gold struggles to make a decisive move in either direction and moves sideways in a narrow channel above $2,300. The benchmark 10-year US Treasury bond yield clings to modest gains near 4.5% and limits XAU/USD's upside.

Gold News

Bitcoin price dips to $61K range, encourages buying spree among BTC fish, dolphins and sharks

Bitcoin price dips to $61K range, encourages buying spree among BTC fish, dolphins and sharks

Bitcoin (BTC) price is chopping downwards on the one-day time frame, while the outlook seen in the one-week period is a horizontal trade. In this shakeout moment, data shows that large holders are using the correction to buy up BTC.

Read more

Navigating the future of precious metals

Navigating the future of precious metals

In a recent episode of the Vancouver Resource Investment Conference podcast, hosted by Jesse Day, guests Stefan Gleason and JP Cortez shared their expert analysis on the dynamics of the gold and silver markets and discussed legislative efforts to promote these metals as sound money in the United States.

Read more

Majors

Cryptocurrencies

Signatures