EUR/JPY: Bears looking for a correction need to bide their time

The EUR/JPY pair has been advancing for over a month now on the continuously evolving fundamental factors. The most recent hike was initiated in late-June when Germany and France - the largest and second-largest economies in the Eurozone respectively - delivered better-than-expected industrial numbers for June. Notable gains in the services and manufacturing sectors of the two countries' industries were registered despite the persisting coronavirus fallout. The robust industrial data reinvigorated investors' optimism, which consequently strengthened the euro.
In the short run, EUR/JPY's rally has been supported by traders' enthusiasm stemming from the summit talks in Brussels. European leaders have been leading rocky negotiations since last week over the proposal of a new stimulus package for the coronavirus-stricken economies of the bloc.
Earlier today, it was announced that the hardliners in the negotiations - the Netherlands, Austria, Sweden, and Denmark- have come close to agreeing upon the 390 billion euros (mostly in grants), which have been proposed by Germany and France. The reconciliation between Europe's fiscally responsible north and poorer south is welcoming news for investors and politicians alike. The striking of an accord in Brussels would mean that European leaders would have managed to ensure the bloc's economic stability in addition to protecting its political cohesion.
Both of these factors are likely to continue strengthening the single currency, while the situation is slightly different for the yen. Last week, the Bank of Japan decided to maintain the negative interest rate of -0.10 per cent unchanged, amidst rising concerns of a second coronavirus wave.
Even though Kuroda and his colleagues expressed their optimism regarding Japan's prospects for a robust recovery, they also underlined the unpredictability of the current situation. In the Monetary Policy Statement, the BOJ's Governing Council stressed that uncertainty stemming from the pandemic continues to pose a significant threat for the tentative recovery process. The demand for the yen, as a well-known safe haven asset, saw a sizable resurgence last week following the release of BOJ's Monetary Policy report.
1. Long-Term Outlook:
As can be seen on the daily chart below, EUR/JPY's price action has undergone through four distinct stages in its development since the coronavirus pandemic started affecting the global capital markets. Initially, it was fluctuating erratically between mid-February and late-March, as adverse volatility soared during this period. The second stage saw the price action depreciate in a distinctive 1-5 impulse wave pattern, as postulated by the Elliott Wave Theory.
The third stage was initiated in the wake of the recovery process, which affected the EUR/JPY positively. The price action rose in a bullish 1-5 impulse wave pattern, which reached its peak just below the major resistance level at 124.000. The fourth stage began with the creation of a new dropdown below the 38.2 per cent Fibonacci retracement level at 120.602, which was followed by a snap reversal.
At present, the price action is developing a flag pattern, which could likely indicate a future trend reversal, but for the time being, the EUR/JPY continues to advance on the positive developments in Brussels.
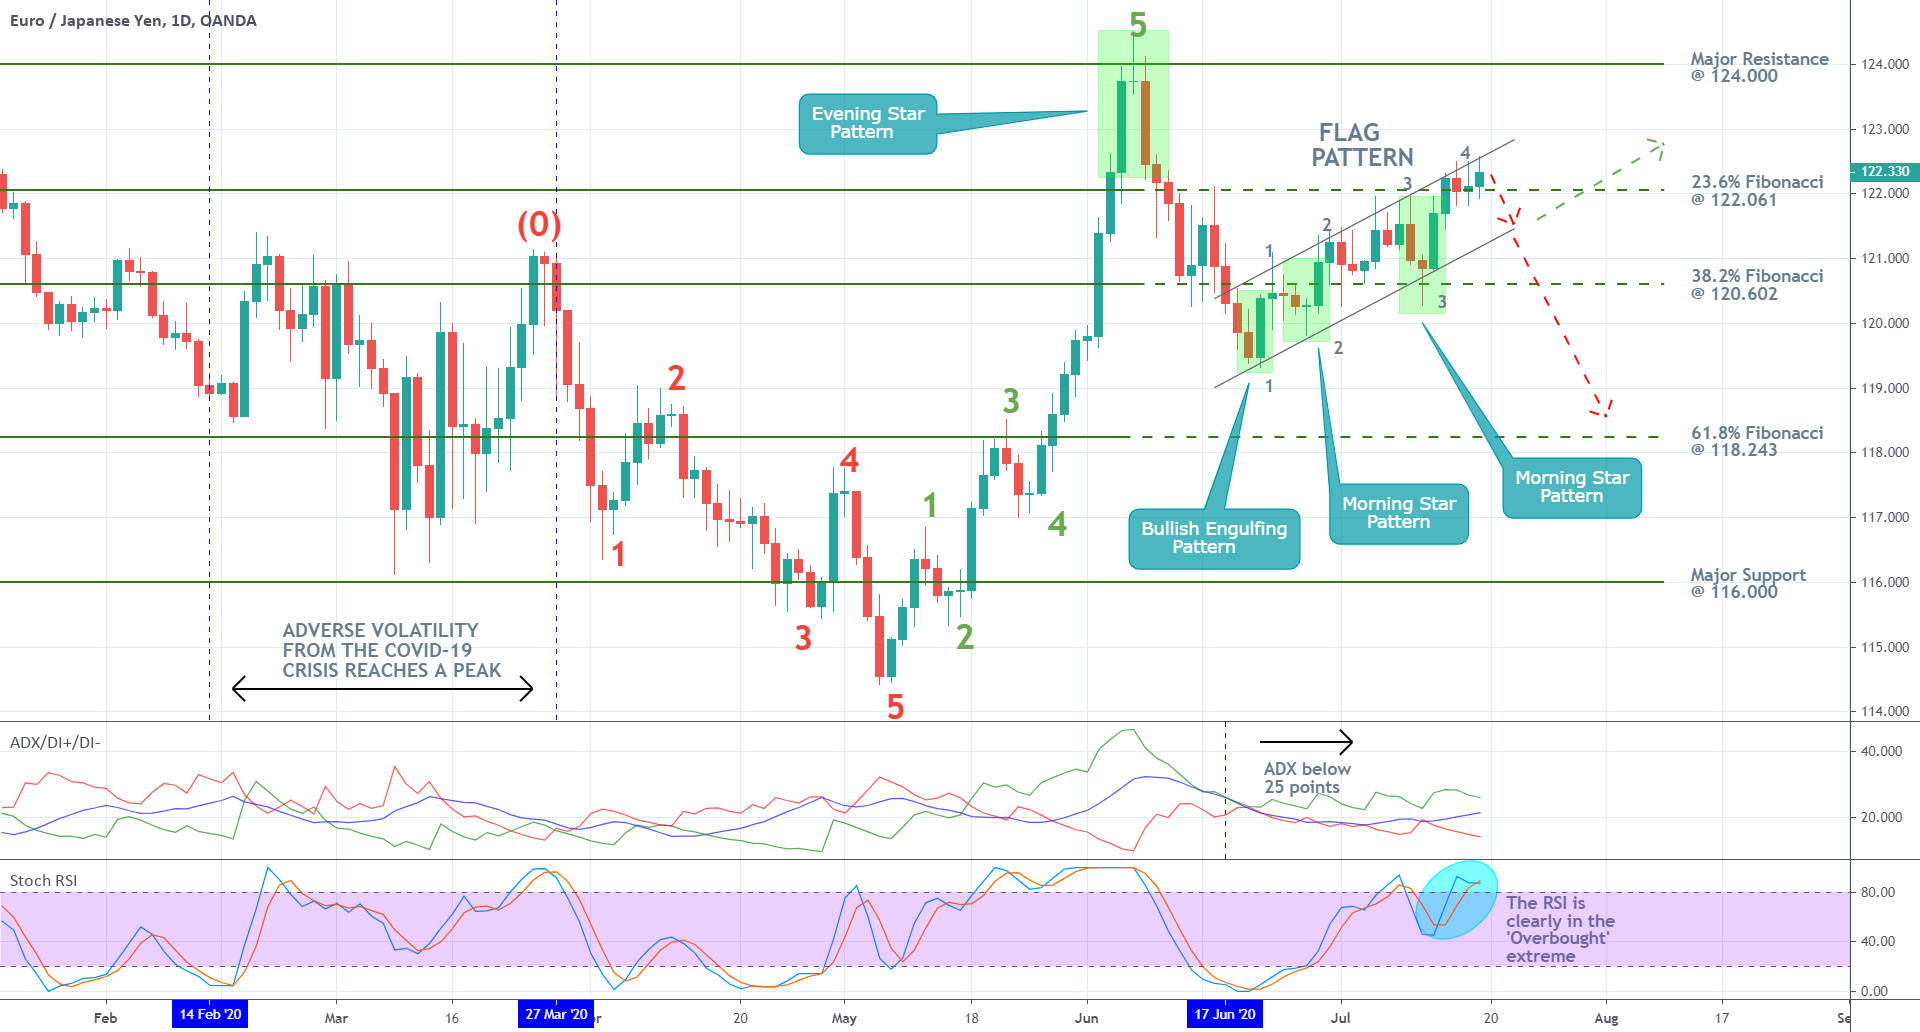
On the one hand, traders' betting on a successful conclusion to the negotiations between the European leaders is likely to continue supporting the euro's rally in the immediate future. Accordingly, the EUR/JPY is currently consolidating above the 23.6 per cent Fibonacci retracement level at 122.061 following the recent breakout. These two factors alone indicate the solid bullish sentiment in the market, because of which the EUR/JPY could continue appreciating within the boundaries of the ascending channel.
On the other hand, the ADX has been threading below 25 points since the 17th of June. Thus, the longer-term market sentiment remains ostensibly range-trading, despite the recent surge of bullish pressures. This favours the emergence of a bearish correction. Moreover, the Stochastic RSI indicator has recently entered into the 'Overbought' extreme, which could prompt the bears to action once the market is done pricing in the developments in Brussels.
The final observation that points to a likely trend reversal is relating to the currently evolving flag pattern. The price action has made three points of contact with the flag's lower boundary and four points of contact with its upper boundary. Such behaviour is commonly found in bearish flags. Hence, a dropdown towards the channel's lower boundary is quite possible. Subsequently, the price action could test its strength and attempt to break down below it as well.
2. Short-Term Outlook:
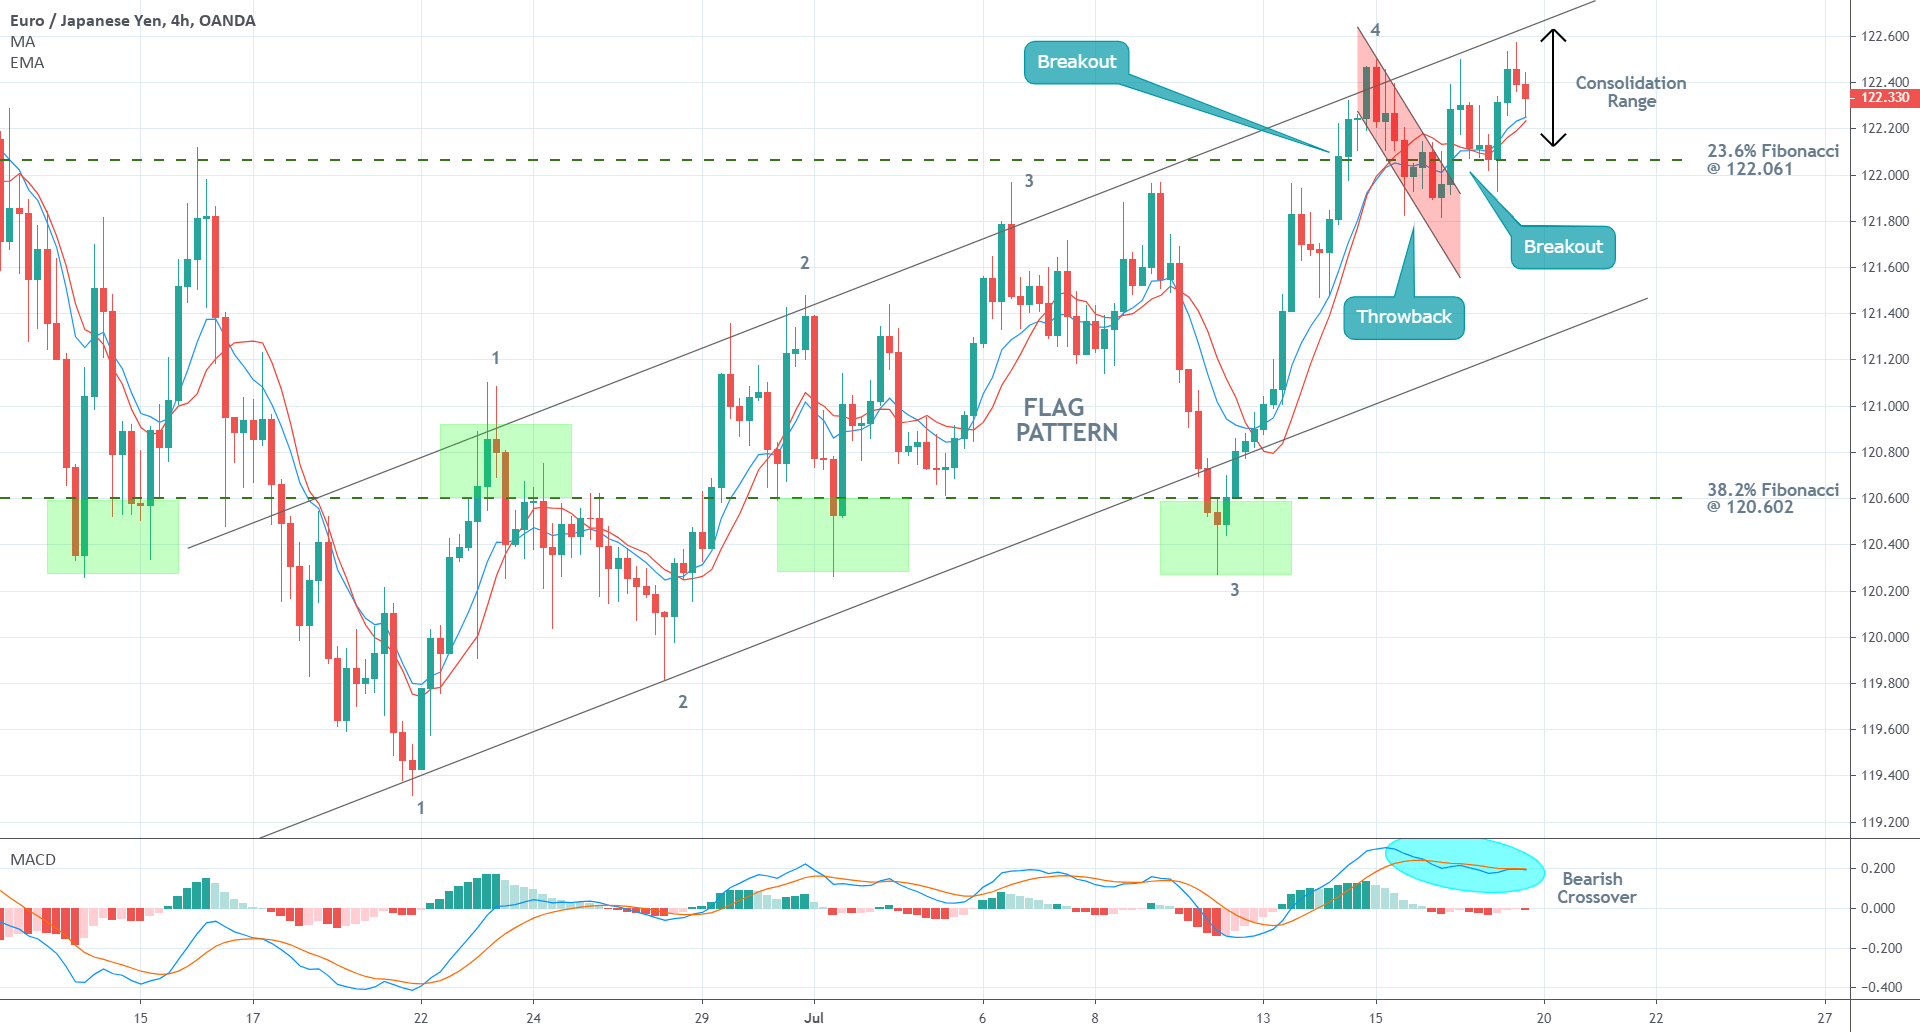
In the immediate future, the price action is likely to remain contained within the 23.6 per cent Fibonacci retracement level and the channel's upper limit. This can be seen on the 4H chart below.
After the initial breakout above the resistance level at 122.061, the price action developed a minor throwback below the prominent level. Next, the EUR/JPY rose above the resistance yet again, which demonstrates the robust bullish commitment in the market. Accordingly, the 10-day EMA (in blue) is threading above the 10-day MA (in red). For as long as this relationship is preserved, the EUR/JPY is likely to continue consolidating in range, with a moderate bullish bias.
An examination of the underlying market momentum confirms these expectations. The MACD indicator continues to be illustrating the prevailing bullish momentum; however, the recent bearish crossover could be interpreted as an indication of rising bearish pressures in the short-term.
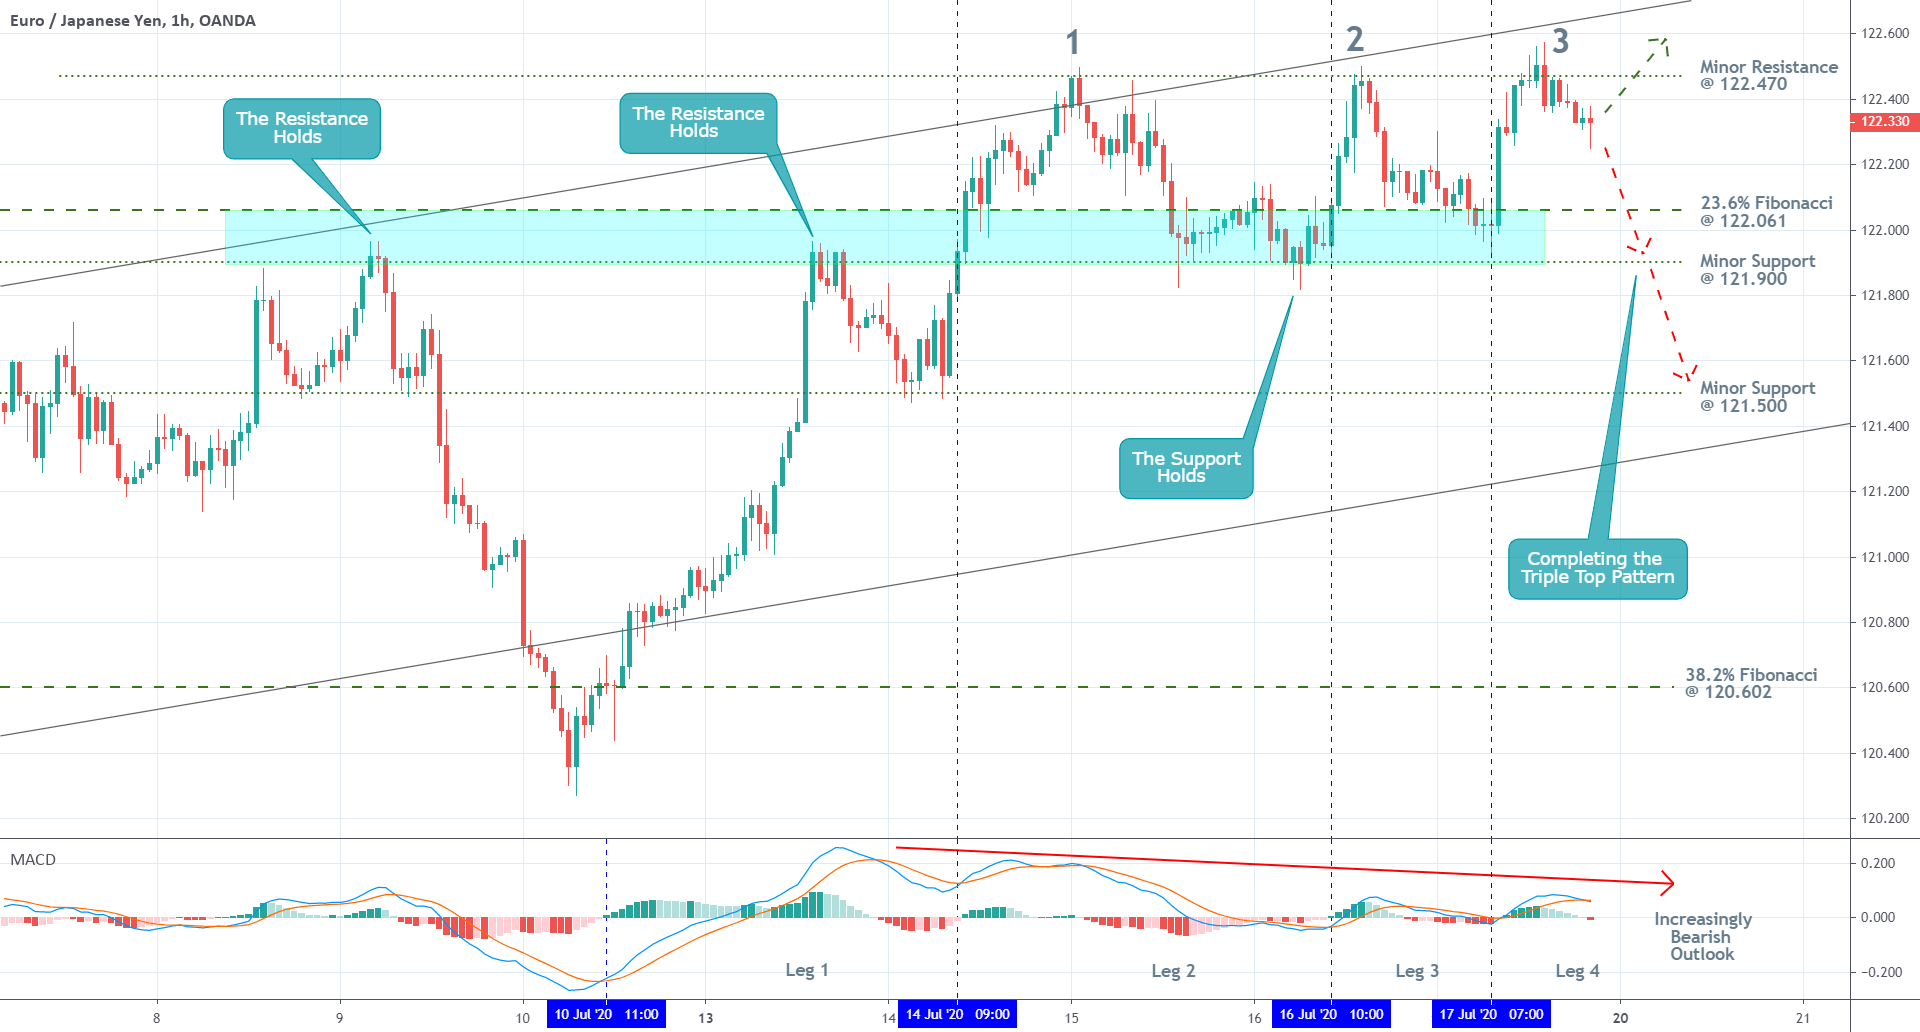
As can be seen on the hourly chart below, the price action has already failed to break out above the minor resistance level at 122.470 on three separate occasions. This has led to the establishment of a triple top pattern, which is typically entailing bearish sentiment. Nevertheless, the market bears should not expect an immediate dropdown on this signal alone.
The price action could break out above the minor resistance level, being influenced by the current fundamental developments, but remain below the channel's upper boundary. Such a scenario would mean that the market is not yet ready to develop a bearish correction.
Once this starts to happen, however, the price action would have to subsequently break down below the 23.6 per cent Fibonacci at 122.061, and the minor support level at 121.900 before a more sizable correction can be anticipated to unfold.
3. Concluding Remarks:
There are many ways that traders could approach the EUR/JPY at present. While there is a good chance for the pair to resume its hike in the immediate future, bulls should not rush to join the trend at any cost. The market is already pricing in the aforementioned fundamental factors, which involves the possibility of a snap reversal once the process is completed.
Meanwhile, the situation for the bears is also similar in the sense that they should not rush to bet on an imminent trend reversal. It may be some time before the market completely discounts the news, and the EUR/JPY is ready to develop a new bearish correction. A breakdown below the 23.6 per cent Fibonacci retracement level would manifest a substantial piece of evidence supporting this.
Author

Plamen Stoyanov
Trendsharks
Plamen started his career on the global capital markets in 2012 when he began trading with financial derivatives.


