Elliott Wave view: USD/JPY approaching turning area [Video]
![Elliott Wave view: USD/JPY approaching turning area [Video]](https://editorial.fxstreet.com/images/Markets/Currencies/Majors/USDJPY/yen-japones-billetes-de-banco_XtraLarge.jpg)
Rally in USDJPY from 1.16.2023 low takes the form of a 3 swing and about to reach the extreme area. The 100% – 161.8% Fibonacci extension form 1.16.2023 low comes at 140.4 – 147.1 where sellers can appear. This suggests that USDJPY is close to the time window where pair can see at least a 3 waves pullback. Short term, USDJPY’s rally from 5.4.2023 low is in progress as a 5 waves impulse Elliott Wave structure as the 1 hour chart below shows. Up from 5.4.2023 low, wave 1 ended at 135.47 and pullback in wave 2 ended at 133.73. Internal subdivision of wave 2 unfolded as a zigzag where wave ((a)) ended at 133.88, wave ((b)) ended at 134.84, and wave ((c)) lower ended at 133.73. This completed wave 2 in higher degree.
USD/JPY 60 minutes Elliott Wave chart
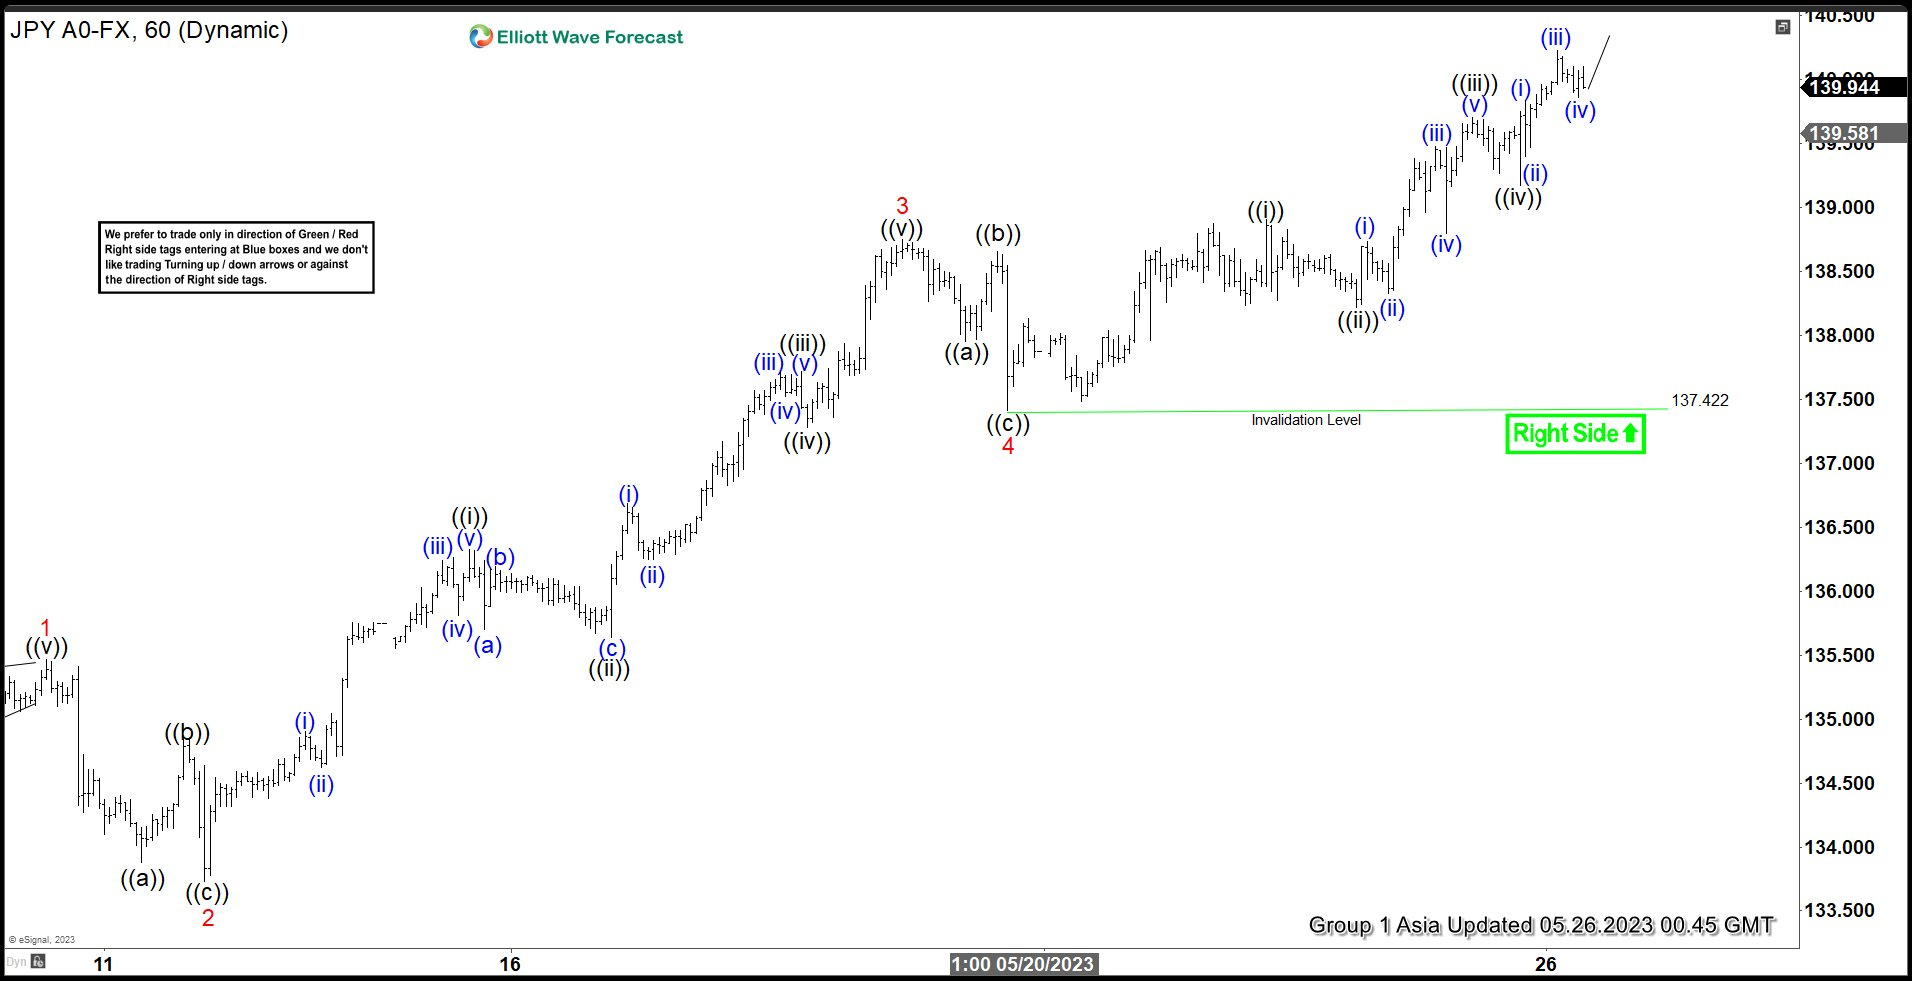
Pair resumes higher in wave 3 with internal subdivision as another 5 waves in lesser degree. Up from wave 2, wave ((i)) ended at 136.32 and pullback in wave ((ii)) ended at 135.64. Pair resumes higher in wave ((iii)) towards 137.72 and dips in wave ((iv)) ended at 137.27. Final leg wave ((v)) ended at 138.74 which completed wave 3. Pair then pullback in wave 4 towards 137.42 with internal subdivision as a zigzag. Down from wave 3, wave ((a)) ended at 137.95, wave ((b)) ended at 138.65, and wave ((c)) ended at 137.42. Wave 5 higher is in progress as 5 waves. Up from wave 4, wave ((i)) ended at 138.9 and wave ((ii)) ended at 138.22. Wave ((iii)) ended at 139.69 and pullback in wave ((iv)) ended at 139.17. As far as pivot at 137.42 low stays intact, expect pair to find support in 3, 7, or 11 swing for further upside.
USD/JPY Elliott Wave video
Author

Elliott Wave Forecast Team
ElliottWave-Forecast.com


