|

Elliott Wave View: S&P 500 (SPX) Rallies as an Impulse

Since bottoming at 2346.58 on December 26, 2018,  S&P 500 (SPX) has rallied 18% in less than 2 months. The structure of the rally appears like an Impulse Elliott Wave structure. An Impulse structure is a 5 waves move. The Index is now within wave ((3)) of the possible 5 waves move from December 26 low. Subdivision of wave ((3)) unfolded as another 5 waves of lower degree where wave (3) ended at 2738.98 and wave (4) ended at 2681.83.

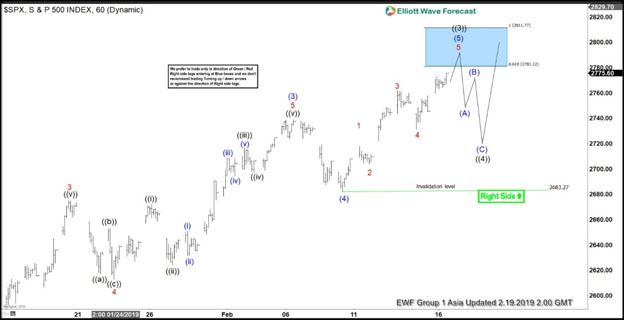
Wave (5) of ((3)) is currently in progress towards a potential target of 2781.12 – 2811.77 (blue box). The Index should then pullback in wave ((4)) to correct wave ((3)) rally from December 28, 2018 low (2397.94). The pullback should later unfold and find buyers in the sequence of 3, 7, or 11 swing. In Elliott Wave Theory, wave 4 typically correct wave 3 at 23.6 – 38.2 Fibonacci retracement. We need to wait for wave ((3)) to complete before we can project a more accurate retracement area. If we assume wave ((3)) ends at 2781 (the blue box), then potential area for the Index to end the wave ((4)) correction is approximately 2635 – 2691.

Once the Index ends the correction, it still has a chance to extend higher 1 more leg in wave ((5)). Alternate view suggests that the Index ends wave ((5)) already in the current rally instead of wave ((3)). In the alternate view, Index should correct the entire rally from December 26, 2018 low in the next pullback.

S&P 500 (SPX) 1 Hour Elliott Wave Chart

SP500

S&P 500 (SPX) Chart Of The Day Video


Become a Successful Trader and Master Elliott Wave like a Pro. Start your Free 14 Day Trial at - Elliott Wave Forecast.

Author

Elliott Wave Forecast Team

Elliott Wave Forecast Team

ElliottWave-Forecast.com

More from Elliott Wave Forecast Team
Share:

Editor's Picks

EUR/USD looks offered below 1.1900

EUR/USD keeps its bearish tone unchanged ahead of the opening bell in Asia, returning to the sub-1.1900 region following a firmer tone in the US Dollar. Indeed, the pair reverses two consecutive daily gains amid steady caution ahead of Wednesday’s key US Nonfarm Payrolls release.
 

GBP/USD slips back to daily lows near 1.3640

GBP/USD drops to daily lows near 1.3640 as sellers push harder and the Greenback extends its rebound in the latter part of Tuesday’s session. Looking ahead, the combination of key US releases, including NFP and CPI, alongside important UK data, should keep the pound firmly in focus over the coming days.

Gold the battle of wills continues with bulls not ready to give up

Gold remains on the defensive and approaches the key $5,000 region per troy ounce on Tuesday, giving back part of its recent two day. The precious metal’s pullback unfolds against a firmer tone in the US Dollar, declining US Treasury yields and steady caution ahead of upcoming key US data releases.

Bitcoin's downtrend caused by ETF redemptions and AI rotation: Wintermute

Bitcoin's (BTC) fall from grace since the October 10 leverage flush has been spearheaded by sustained ETF outflows and a rotation into the AI narrative, according to Wintermute.

Dollar drops and stocks rally: The week of reckoning for US economic data

Following a sizeable move lower in US technology Stocks last week, we have witnessed a meaningful recovery unfold. The USD Index is in a concerning position; the monthly price continues to hold the south channel support.

XRP holds $1.40 amid ETF inflows and stable derivatives market

Ripple trades under pressure, with immediate support at $1.40 holding at the time of writing on Tuesday. A recovery attempt from last week’s sell-off to $1.12 stalled at $1.54 on Friday, leading to limited price action between the current support and the resistance.