|

DAX Elliott Wave Analysis: Bounce Can be Temporary

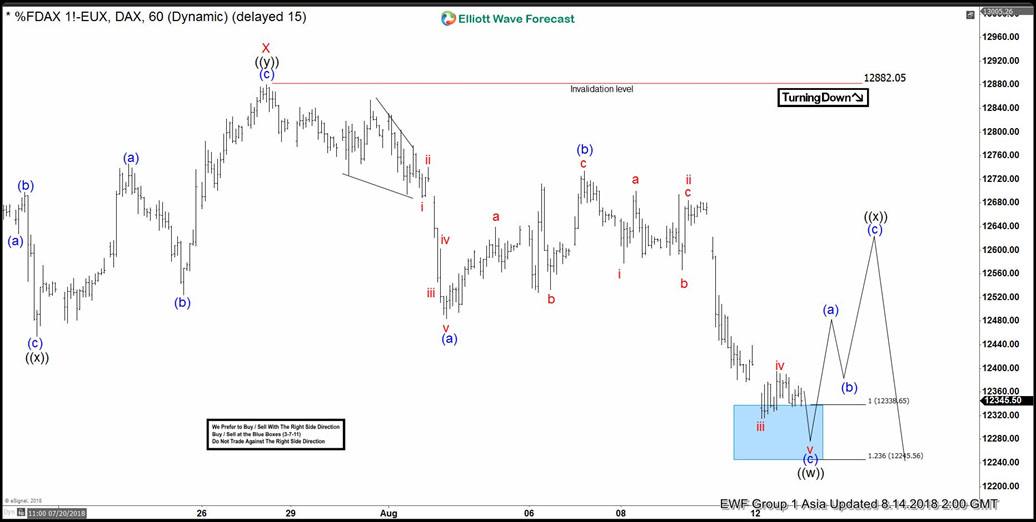
DAX short-term Elliott wave analysis suggests that the rally to 12882.05 high ended Minor wave X bounce. The internals of that bounce unfolded as Elliott wave double three structure where Minute wave ((w)) ended at 12640.87. Minute wave ((x)) ended at 12468.68 and Minute wave ((y)) of X ended at 12882.05 high. Down from there, the decline is showing the overlapping price action suggesting that the decline in Minor wave Y is taking place as 3 wave corrective sequence i.e either ((w)),((x)),((y)) or ((w)),((x)),((y)),((x)),((z)) structure in Minute degree.

The initial decline from 12882.05 high is unfolding as Elliott wave zigzag correction in Minute wave ((w)) lower. Where minutte wave (a) ended in 5 waves structure at 12494 low. Up from there, the bounce to 12740.12 high ended Minutte wave (b) bounce in 3 swings. Decline from there is taking place in another 5 waves structure & reached the 12338.65-12245.56 100%-123.6% Fibonacci extension area of (a)-(b) to end Minutte wave (c) of ((w)). And soon, the index is expected to do a Minute wave ((x)) bounce in 3, 7 or 11 swings against 12882.05 high before further decline in Minute wave ((y)) of Y is seen. We don’t like selling it.

DAX 1 Hour Elliott Wave Chart
DAX
DAX

Become a Successful Trader and Master Elliott Wave like a Pro. Start your Free 14 Day Trial at - Elliott Wave Forecast.


Author

Elliott Wave Forecast Team

Elliott Wave Forecast Team

ElliottWave-Forecast.com

More from Elliott Wave Forecast Team
Share:

Editor's Picks

AUD/USD flirts with 0.7000, lowest since early August amid bullish USD

AUD/USD hits a fresh low since early August during the Asian session on Friday and looks vulnerable near 0.7000 after breaking below the 200-day SMA overnight. Against the backdrop of the hawkish Fed, a two-day rally in oil prices revives inflation fears and continues to push US bond yields to multi-year highs. Adding to this, geopolitical risks lift the US Dollar to a two-month high, overshadowing RBA rate hike bets and weighing on the pair.

USD/JPY pulls back from three-week high after failing near 159.00

USD/JPY edges lower during the Asian session on Friday, stalling its recent strong move to a three-week high of 159.00 as Japanese Yen bears turn cautious amid intervention fears. Meanwhile, the US Dollar retains a strong bullish undertone as the Fed's hawkish outlook and oil-driven inflation fears continue to push US bond yields to multi-year peaks. Furthermore, the BoJ's dovish rate hike last week might cap JPY and support spot prices.

Gold treads water below $4,300

Gold grabs some buying attention and advances marginally at the end of the week, partially retracing the weekly decline, although it is still navigating below the key $4,300 mark per troy ounce. The fresh selling bias on the Greenback and the modest decline in US Treasury yields appear to support the humble advance in the precious metal.

Crypto Today: Bitcoin and Ethereum edge lower, XRP extends recovery as macro headwinds weigh

The broader cryptocurrency market is consolidating on Friday, with Bitcoin paring losses slightly above $84,000. Ethereum declines in tandem with BTC. Ripple (XRP), meanwhile, paints a different picture.


Fed vs BoJ: Both hiked. The market only believes one of them – and the chart shows which
The Federal Reserve (Fed) and the Bank of Japan (BoJ) have just done something remarkably similar. Both central banks raised interest rates by 25 basis points (bps) last week, both are confronting inflation risks, and both signal that future decisions will depend on incoming economic data.
Fed vs BoJ: Both hiked. The market only believes one of them – and the chart shows which

The Fed and the BoJ have just done something remarkably similar. Both central banks raised interest rates by 25 bps last week, both are confronting inflation risks, and both signal that future decisions will depend on incoming economic data.