Construction spending rises in January
- Total construction spending advanced 1.7% during January.
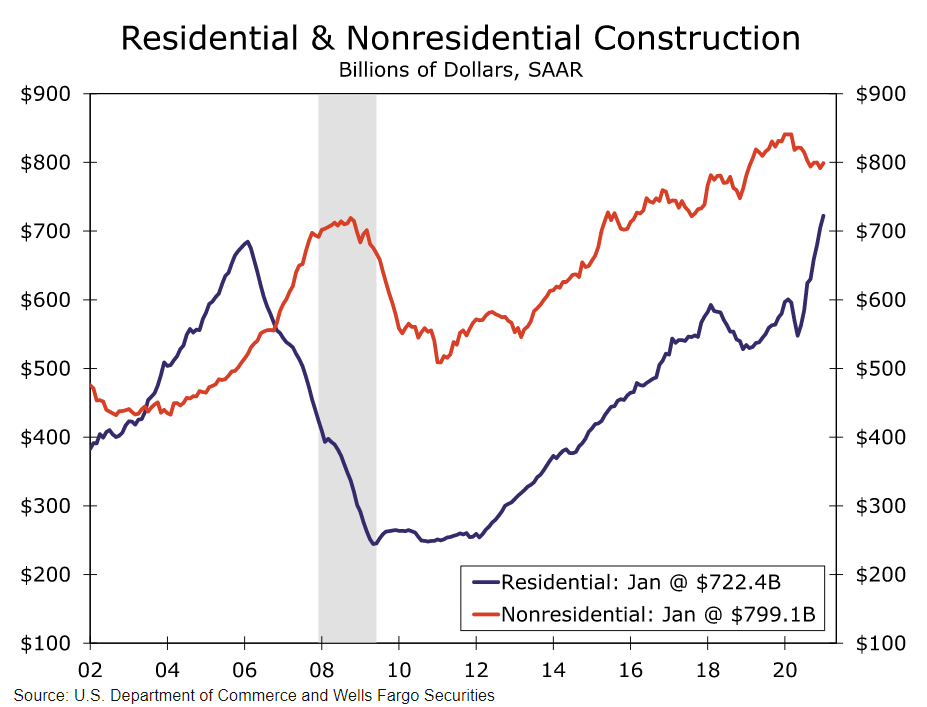
- Most of the gain in overall outlays was driven by the white-hot residential sector. Residential spending rose 2.5% during the month, and is up 21.1% over the year.
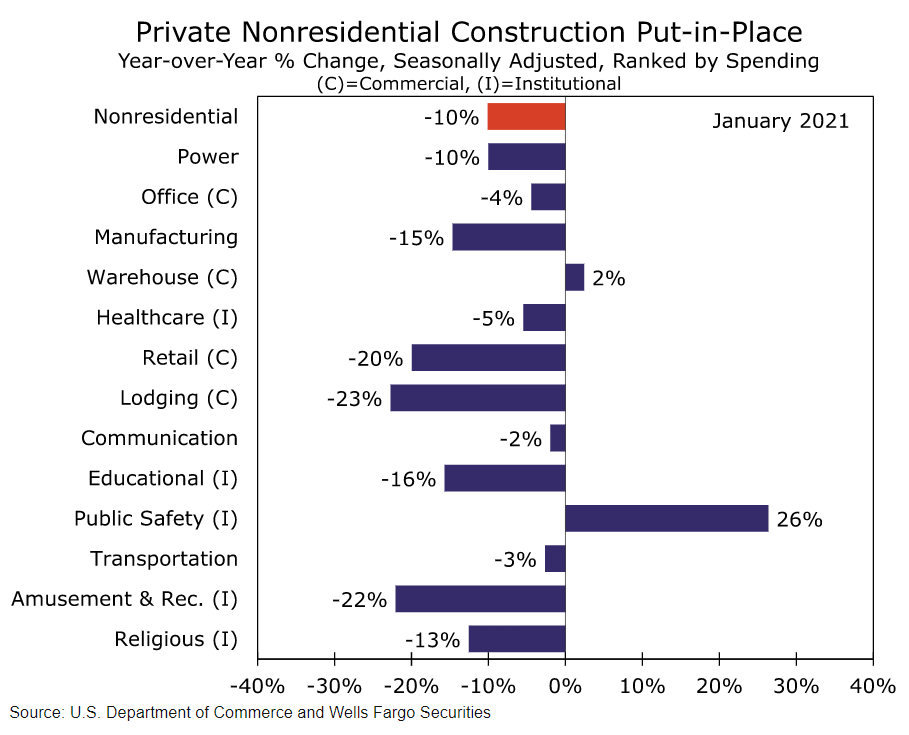
- Nonresidential activity improved 0.9% in January, but spending is still down 5.0% year-over-year. Manufacturing, healthcare and lodging outlays increased during the month, while office and commercial projects declined.
- Public spending climbed 1.7% in January as highway & street construction jumped 5.8%.

Broad-Based Improvement to Start 2021
Construction spending started off the year on the right foot. Total outlays rose a solid 1.7% during January, as residential and nonresidential spending climbed higher. Public outlays also rose 1.7%. Generally speaking, the monthly gain is likely partially owed to unseasonably mild temperatures, which kept weather-related delays at job sites to a minimum. Nevertheless, the broad-based improvement is an encouraging sign that construction activity is holding up relatively well amid the COVID crisis.
Most of the gain in overall outlays was driven by the white-hot residential sector. Residential spending rose 2.5% during the month, and is up 21.1% over the year. Multifamily outlays increased 0.7% during the month. Single-family spending, which has been propelled by low mortgage rates and the increased need for more space, climbed 3.0%. The strong start to the year and upward revision to the prior month's data means residential investment will meaningfully add to first quarter GDP growth.
Demand for single-family new construction and home improvement projects are providing a boost to lumber demand at a time of year when demand tends to soften a bit. The Random Lengths Framing Lumber Composite Price recently ascended to $1,000 per thousand board feet, which is roughly 180% higher than last spring. Fast-rising lumber prices likely boosted the January spending number but might also constrain single-family construction in the months ahead. According to the NAHB, the spike in prices has added approximately $24,000 to the cost of a new home since last April.
Nonresidential Spending Posts Solid Gain
Nonresidential activity improved 0.9% in January, but spending is still down 5.0% year-over-year. Manufacturing outlays jumped 4.7% during the month. New social distancing norms have bolstered consumer spending on both durable and nondurable goods, which has fueled a rapid recovery in manufacturing activity. Reported separately, the ISM manufacturing index matched its highest reading in more than 15 years during February.
Healthcare (+1.1%) and lodging (+0.5%) outlays increased solidly during the month. Commercial (-1.9%) and office (-0.1%) declined as demand for these types of buildings in a post-COVID environment remains highly uncertain. Spending on power projects, which include oil, gas and electric distribution facilities, also fell 0.7%. Through the monthly volatility, however, most major categories of spending are still well below prior-year levels.
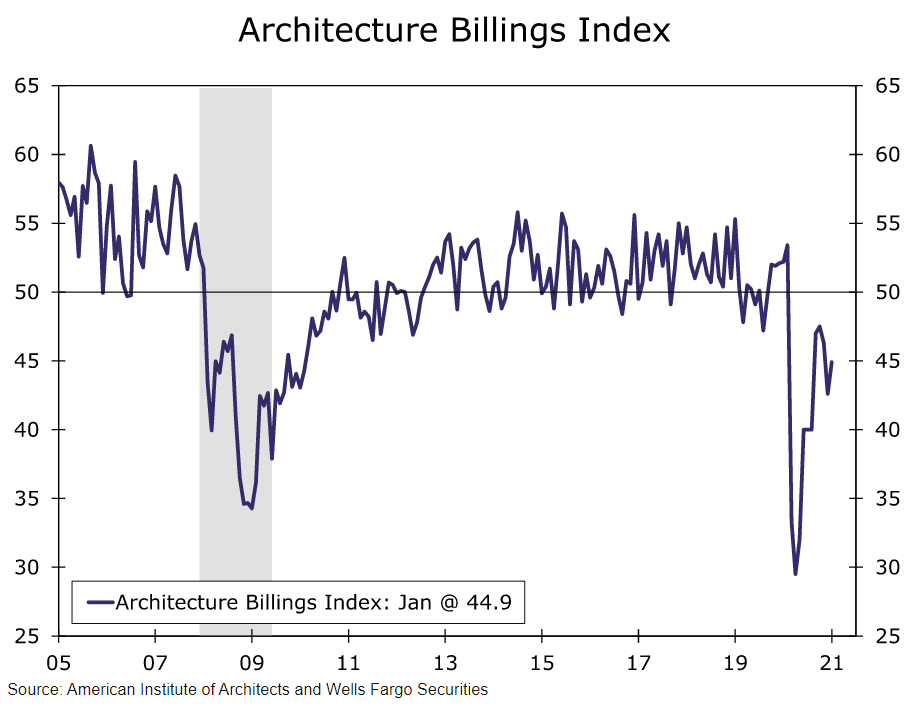
Modest Improvement in the ABI during January
The Architecture Billings Index (ABI) points to another challenging year ahead for the construction industry. The overall index, which leads nonresidential construction spending by about nine to 12 months, rose to 44.9 from 42.6 the month prior. The monthly reading was once again below 50, which indicates a majority of firms experienced a decline in firm billings. That said, there are some green shoots, which suggest conditions are starting to improve. During January, firms reported new inquiries for work reached their highest level since the start of the pandemic. What's more, firms in the South region are much closer to returning to expansion territory (above the 50 demarcation line), although activity in the Northeast, West and Midwest remains far below prior-year levels.
Author

Wells Fargo Research Team
Wells Fargo


