Commodities Weekly: Agricultural commodities lifted by trade deal

Commodity prices rose last Friday after it was announced that the US and China had agreed in principle to the so-called Phase 1 trade deal. Under the deal, some tariffs were reduced, the latest ones were cancelled, and China promised to buy $200 billion worth of US goods over the next two years, while banning forced technology transfer for American companies entering the China market. Intellectual property policing will also be tightened.
Agriculturals
Of the $200 billion worth of US goods that China agreed to purchase over the next two years, $80-$100 billion is allocated to agricultural produce, so the soft commodities received a boost on the news.
WHEAT prices surged to the highest since August 2018 yesterday, posting the biggest daily gain since October 11 in the process. However, on the weekly chart, the 55-week moving average looks set to move below the 100-week moving average at 4.9020 for the first time since January 2018, which could be interpreted as a medium-term bearish signal. Speculative investors were net sellers of wheat for the first time in five weeks in the week to December 10, CFTC data show.
Argentina raised export taxes on wheat to 12% from 6.7% at the weekend in order to fund additional spending programmes under a new government. Other commodity exports were not spared either, with corn exports now taxed at 12% and soybeans at 30%.
CORN prices rose for a third straight day yesterday, reaching levels not seen in 5-1/2 weeks. The commodity looks to be testing resistance at the 200-day moving average at 3.8048, which has capped prices since November 6.
Corn Daily Chart
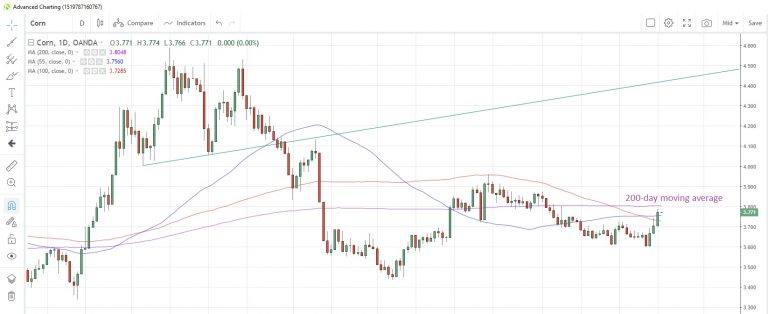
Source: OANDA fxTrade
SOYBEANS have extended the recent rally to a fourth day this morning, rising to the highest level since November 8. The commodity has risen 5.7% so far this month, which would be the biggest monthly gain since November last year. Speculative investors were net sellers for a sixth consecutive week to December 10, pushing net short positioning to the most since September 10.
The eight-week rally to the end of last week has seen speculative positioning in SUGAR turn bullish for the first time since the week of July 9. Sugar is having a bad week so far this week, with yesterday’s decline of 1.3% the biggest intra-day drop in two weeks.
Energy
CRUDE OIL prices have been consolidating Friday’s gains to three-month highs following the announcement of the US-China trade truce. Better-than-expected China industrial production also helped sentiment. China’s apparent oil demand, its oil processing volume plus net imports of refined oil, rose 4.2% y/y in November, according to Bloomberg calculations. Meanwhile the number of US oil rigs in production rose for the first time in eight weeks to December 13, according to data from Baker Hughes.
Speculative investors remain bullish on oil’s prospects, having boosted net long positions to the highest since the week of April 30, according to the latest data snapshot from CFTC as at December 10.
Prices hit the highest since September 17 on Friday, briefly trading above the $60 per barrel mark. They closed above the $60 threshold yesterday, and are currently at $60.116, holding below the 78.6% Fibonacci retracement of the September 16 – October 3 drop at $60.744.
WTI Daily Chart
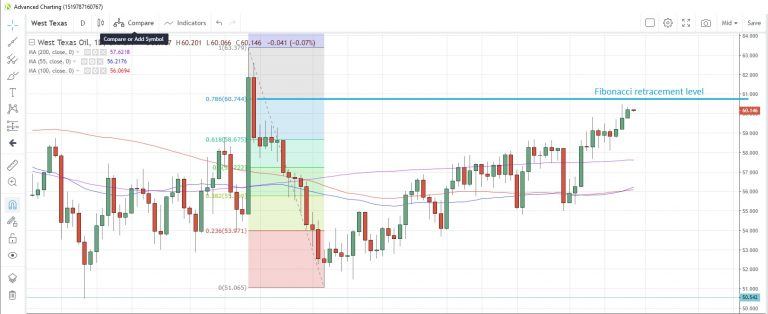
Source: OANDA fxTrade
NATURAL GAS prices are currently rebounding from near four-month lows struck last week, but are approaching an area of moving average resistance, with the 100-day at 2.376, 55-day at 2.409 and the 200-day at 2.438. Prices are now trading at 2.333.
China’s natural gas output increased 8% y/y to 15.1 billion cubic meters (bcm) in November. Data from the Energy Information Administration (EIA) showed gas inventories falling by 73 billion cubic feet (bcf) in the week to December 6, less than the 76 billion expected but still the biggest decline in three weeks.
Speculative investors turned net buyers for the first time in four weeks in the week to December 10, according to CFTC data. That lifted net short positioning from a four-year low.
Precious metals
GOLD prices have been relatively stable recently despite the latest shift in risk appetite since Friday. Indeed, gold prices posted their best week since mid-September last week though they still remain trapped in a wedge chart formation which has been building since September 2. Gold is currently sitting below the 55-day moving average at 1,480.50, which has capped gains on a closing basis since November 4.
SILVER looks set to end its best winning streak since the start of the year as it has advanced for six straight sessions. In the late-December to early-January period the metal was unbeaten for eight consecutive sessions. The metal appears to be stalling ahead of the 55-day moving average at 17.2925, which has capped prices since November 5.
Silver’s out-performance has seen the gold/silver (Mint) ratio slip to an 11-day low after hitting a 3-1/2 month peak at 88.33 on December 6. Speculative investors were net sellers for a second week to December 10, but still remain overall net long of the metal.
Last week saw PLATINUM prices jump the most in seven weeks amid hopes for the US-China trade negotiations. Speculative investors were the most bullish on platinum since August 2016, according to the latest report as at December 10 from CFTC. The metal is comfortably above the 200-day moving average at 873.56, which has supported prices since July 15.
PALLADIUM scaled new heights yesterday as the global supply shortfall continues to push prices higher. The positive outlook generated by the US-China trade truce is prompting further buying, and speculative accounts will be rejoicing as they buoyed net long positions to the most in five weeks in the latest reporting week to December 10, ahead of the rally.
Base metals
COPPER prices climbed to a seven-month high on Friday after the trade truce was revealed amid hopes for rising demand from the industrial sector as the global economy tries to get back on track. However, gains were not sustained on the day, probably due to a lack of details on the agreement, and copper closed lower on the day, the first time in eight days.
Speculative investors have been net short of the commodity since end-April but net-buying over the past two weeks has seen shorts trimmed to the least since the week of May 7, according to the latest data from CFTC.
The seven day rally was halted on Friday just above the 61.8% Fibonacci retracement of the April 17 to September 3 decline at 2.7936. Copper is now at 2.7918.
Copper Daily Chart
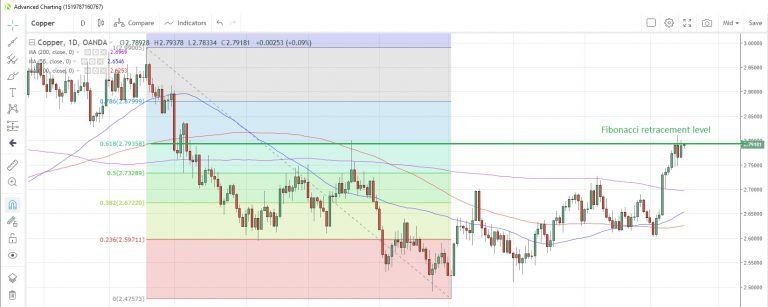
Source: OANDA fxTrade
Author

Andrew Robinson
MarketPulse
A seasoned professional with more than 30 years’ experience in foreign exchange, interest rates and commodities, Andrew Robinson is a senior market analyst with OANDA, responsible for providing timely and relevant market commentar


