|

Chart Of The Week: USD/JPY moves in on familiar price acceptance area

  • Risk-off flows not supporting yen, bulls in control seeking out the 114 handle.
  • Symmetrical Triangle breaking down to the upside, eyes on 112.50s.
  • Resistance levels to hold in near-term, ahead of low volume nodes. 

The 2015-2020 downtrend has been taken put and bulls are controlling with a  weekly close above 110.31. Bulls can target a run beyond 112.50s for a move towards 114.55, 2018 high. 

USD/JPY monthly chart: Symmetrical Triangle

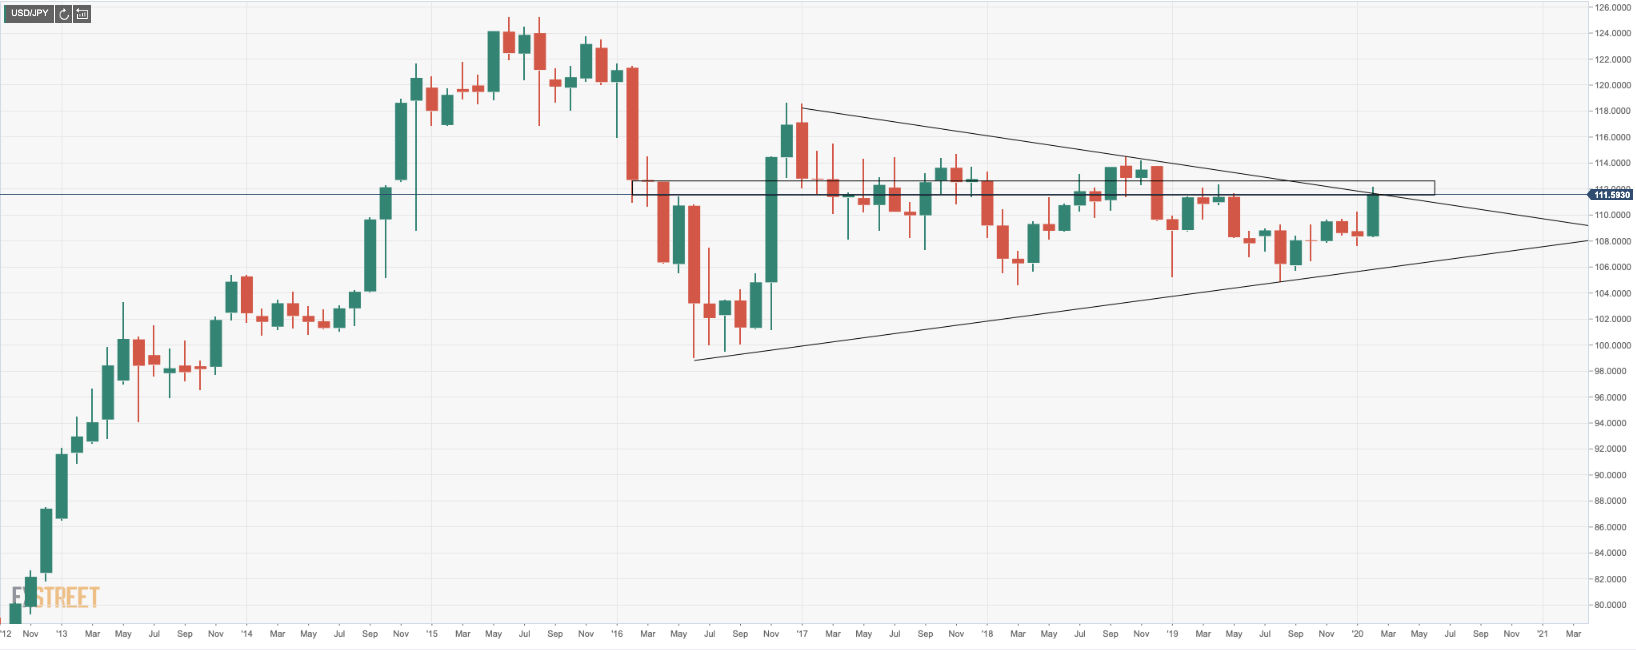
Characterized by two converging trend lines connecting a series of sequential peaks and troughs, the symmetrical triangle (ST) could lead to an extensive breakout, one way or the other, although a critical level of resistance at this juncture will need to give in. We have been here before and 112.50/113.00 has been a high area of acceptance by the bulls and bears, so we could see a period of consolidation prior to extensive gains towards the 114 handle. 

Break-out may struggle through two key resistance areas

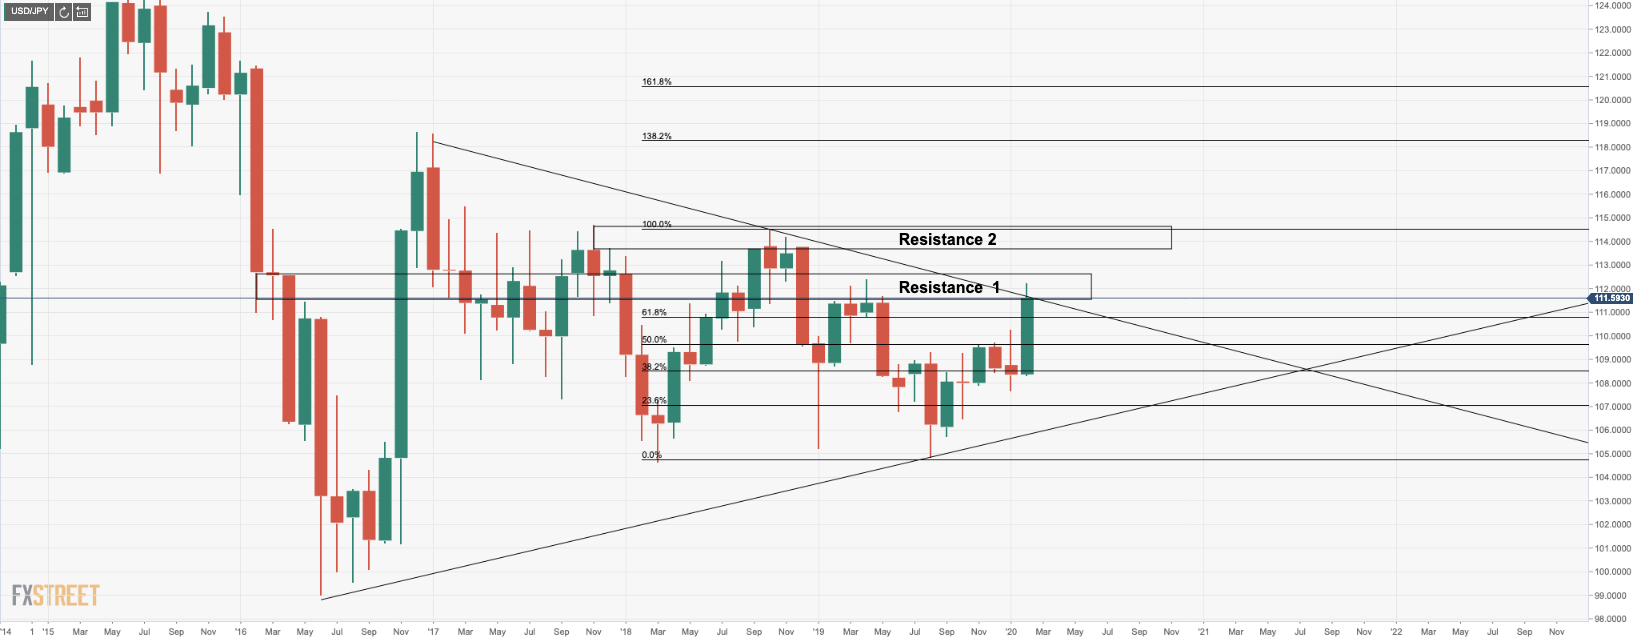
The 61.8% Fibonacci has been priced and the price is now testing the ST's resistance. Resistance 1 on the chart may lead to a head fake on initial attempts beyond the resistance and then the 112 handle. Resistance 2 will likely hold numerous attempts through the 114.55, 2018 high. 

Bulls to target low volume nodes 

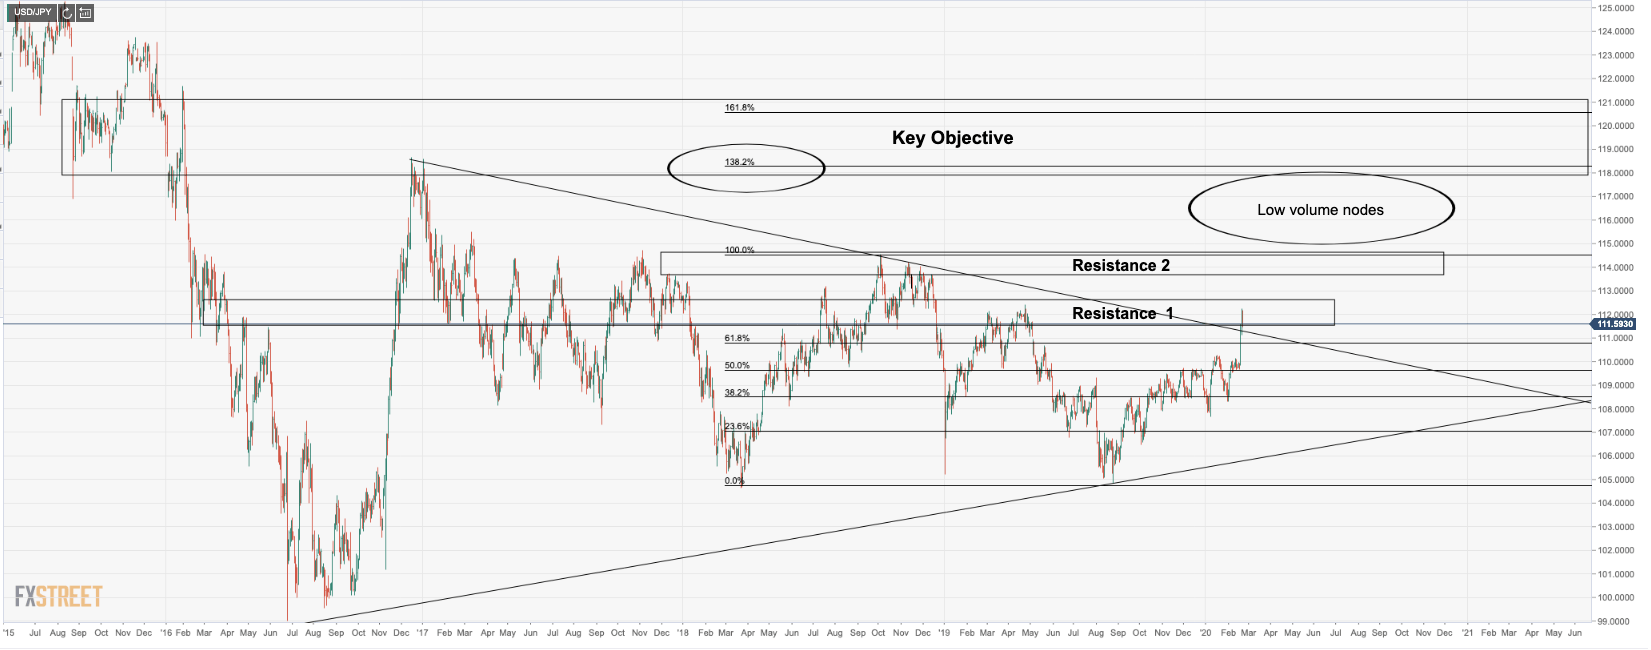
As far fetched as it may seem, the reality is that the yen correlation to risk-off has been dismantled in recent sessions. Gold has rallied some 6.5% vs the US dollar yet the yen has dropped 3.6% in the same time frame. The coronavirus and economic impact it is seen to have in Asia is the likely reason for an exodus from the yen. On such a foundation, it is more feasible to see USD/JPY rally and should it breach the Resistance 2 on the chart above, according to historic price action, there would appear to be little resistance towards a 138.2% and 116.8% levels, the 'Key Objective' area marked out on the chart above. 

Author

Ross J Burland

Ross J Burland, born in England, UK, is a sportsman at heart. He played Rugby and Judo for his county, Kent and the South East of England Rugby team.

More from Ross J Burland
Share:

Markets move fast. We move first.

Orange Juice Newsletter brings you expert driven insights - not headlines. Every day on your inbox.

By subscribing you agree to our Terms and conditions.

Editor's Picks

EUR/USD falls toward 1.1700 on broad USD recovery

EUR/USD turns south and declines toward 1.1700 on Wednesday. The US Dollar gathers recovery momentum and forces the pair to stay on the back foor, as traders look to USD short-covering ahead of US inflation report on Thursday. However, the downside could be capped by hawkish ECB expectations. 

GBP/USD trades deep in red below 1.3350 after soft UK inflation data

GBP/USD stays under strong selling pressure midweek and trades below 1.3350. The UK annual headline and core CPI rose by 3.2% each, missing estimates of 3.5% and 3.4%, respectively, reaffirming dovish BoE expectations and smashing the Pound Sterling across the board ahead of Thurday's BoE policy announcements. 

Gold clings to moderate daily gains above $4,300

Following Tuesday's volatile action, Gold regains its traction on Wednesday and trades in positive territory above $4,300. While the buildup in the USD recovery momentum caps XAU/USD's upside, the cautious market stance helps the pair hold its ground.

Bitcoin risks deeper correction as ETF outflows mount, derivative traders stay on the sidelines

Bitcoin (BTC) remains under pressure, trading below $87,000 on Wednesday, nearing a key support level. A decisive daily close below this zone could open the door to a deeper correction.

Monetary policy: Three central banks, three decisions, the same caution

While the Fed eased its monetary policy on 10 December for the third consecutive FOMC meeting, without making any guarantees about future action, the BoE, the ECB and the BoJ are holding their respective meetings this week. 

AAVE slips below $186 as bearish signals outweigh the SEC investigation closure

Aave (AAVE) price continues its decline, trading below $186 at the time of writing on Wednesday after a rejection at the key resistance zone. Derivatives positioning and momentum indicators suggest that bearish forces still dominate in the near term.