Jobs numbers don't propel markets

USD: Mar '26 is Up at 98.180.
Energies: Jan '26 Crude is Up at 56.09.
Financials: The Mar '26 30 Year T-Bond is Lower by 15 ticks and trading at 115.01.
Indices: The Dec '25 S&P 500 emini ES contract is 100 ticks Higher and trading at 6881.25
Gold: The Feb'26 Gold contract is trading Up at 4347.90.
Initial conclusion
This is not a correlated market. The USD is Up and Crude is Up which is not normal, but the 30 Year T-Bond is trading Lower. The Financials should always correlate with the US dollar such that if the dollar is Higher, then the bonds should follow and vice-versa. The S&P is Higher and Crude is trading Higher which is not correlated. Gold is trading Higher which is not correlated with the US dollar trading Up. I tend to believe that Gold has an inverse relationship with the US Dollar as when the US Dollar is down, Gold tends to rise in value and vice-versa. Think of it as a seesaw, when one is up the other should be down. I point this out to you to make you aware that when we don't have a correlated market, it means something is wrong. As traders you need to be aware of this and proceed with your eyes wide open. All of Asia traded Higher with the exception of the Sensex and Singapore exchanges. Currently Europe is trading Higher except the Paris exchange.
Possible challenges to traders
- FOMC Member Waller Speaks at 8:15 AM EST. This is Major.
- FOMC Member Williams Speaks at 9:05 AM EST. This is Major.
- Crude Oil Inventories are out at 10:30 AM EST. This is Major.
- FOMC Member Bostic Speaks at 12:30 PM EST. This is Major.
Traders, please note that we've changed the Bond instrument from the 10 Year (ZN) to the 2 Year (ZT). They work exactly the same.
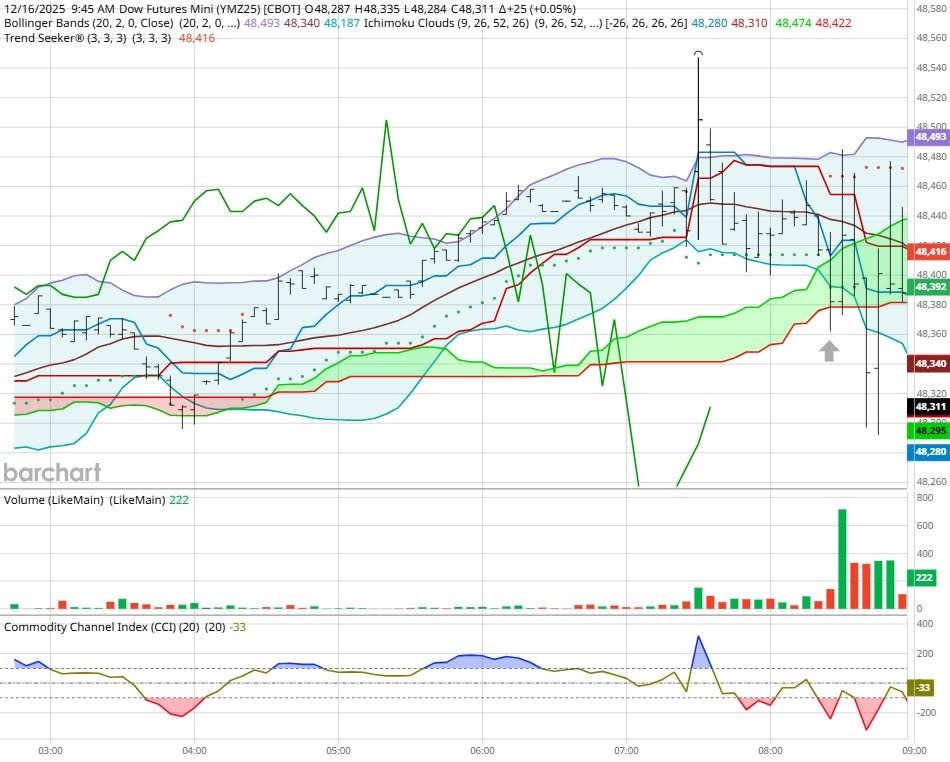
We've elected to switch gears a bit and show correlation between the 2-year Treasury notes (ZT) and the S&P futures contract. The YM contract is the Dow Jones Industrial Average, and the purpose is to show reverse correlation between the two instruments. Remember it's likened to a seesaw, when up goes up the other should go down and vice versa.
Yesterday the ZT dived Lower at around 8:30 AM EST with Non-Farm Payrolls pending. The Dow climbed Higher at around the same time. Look at the charts below and you'll see a pattern for both assets. The ZT dived Lower at around 8:30 AM EST and the Dow climbed Higher at around the same time. These charts represent the newest version of Bar Charts, and I've changed the timeframe to a 15-minute chart to display better. This represented a Short opportunity on the 2-year note, as a trader you could have netted about 20 plus ticks per contract on this trade. Each tick is worth $6.25. Please note: the front month for ZT is now Mar '26 and the Dow is still Dec '25. I've changed the format to filled Candlesticks (not hollow) such that it may be more apparent and visible.
Charts courtesy of barcharts

Bias
Yesterday we gave the markets a Neutral or Mixed bias as Non-Farm Payrolls for November was released. It turned out to be the worst job numbers report in more than 4 years. The Dow dropped 302 points, the S&P dived 16 but the Nasdaq gained 54 so all in all it was a Mixed market. Today our bias will remain Neutral or Mixed.
Could this change? Of Course. Remember anything can happen in a volatile market.
Commentary
Yesterday we had Job numbers that showed the worst report in more than four years. During the Biden era the report showed an average of at least 100 plus thousand each and every month. Needless to say, this report didn't propel the markets.
Author

Nick Mastrandrea
Market Tea Leaves


