Chart of the Week: Have EUR/JPY bulls more in the tank?
- EUR/JPY bulls take control in the final stages of the week.
- There is a bullish bias for the week ahead, all things considered, down to the hourly time frame.

EUR/JPY is en route for the 131.30/50s so long as hourly support holds up for the start of the week.
The following is a top-down analysis that takes into consideration longer-term outlooks across the individual components of the cross as well.
Monthly chart
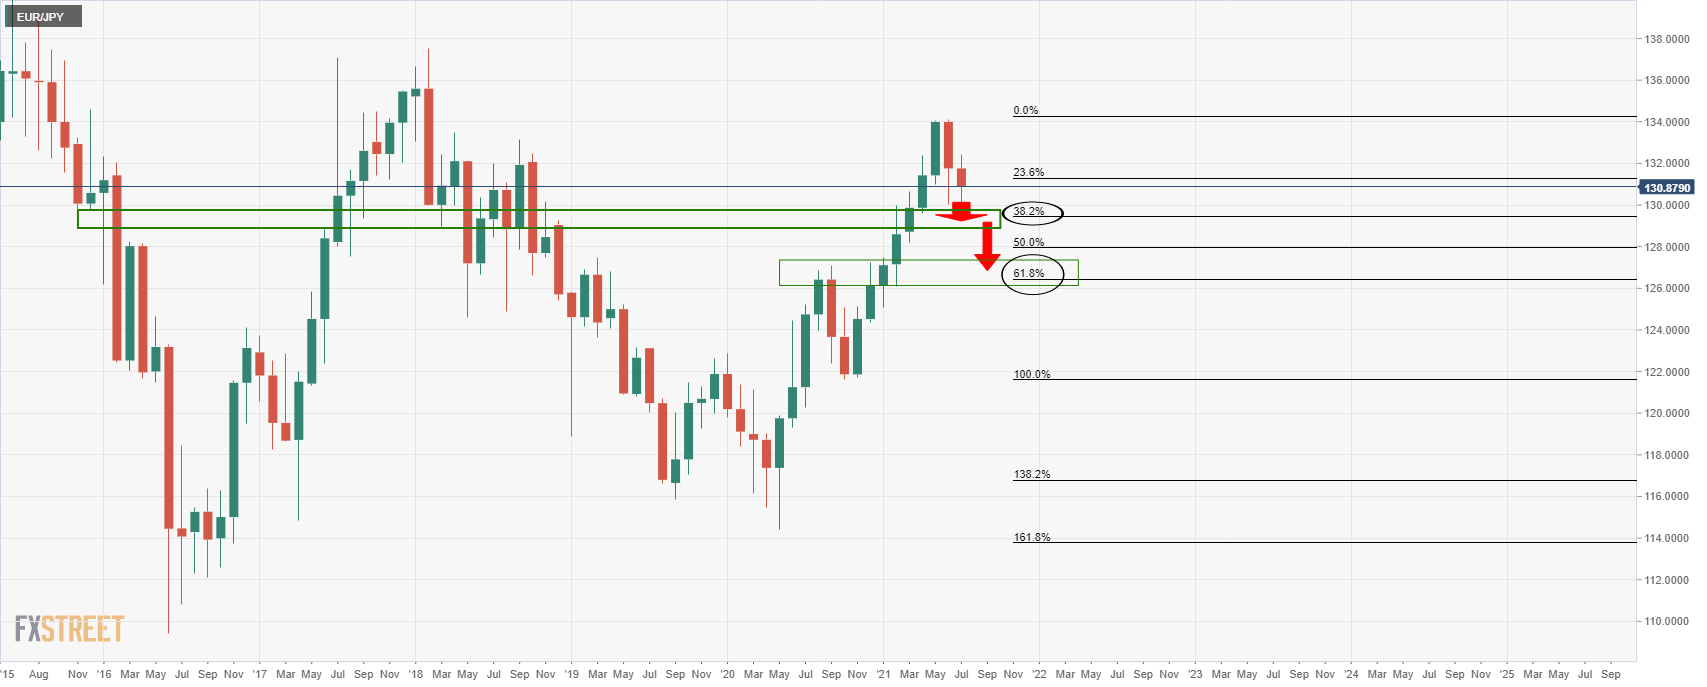
From a monthly perspective, the bias is to the downside.
The 38.2% Fibonacci level near 129.50 would be expected to be tested with a fuller imprint from the bears this month.
A subsequent break there will open prospects of a 61.8% Fibonacci retracement around 126.50.
EUR/JPY weekly chart
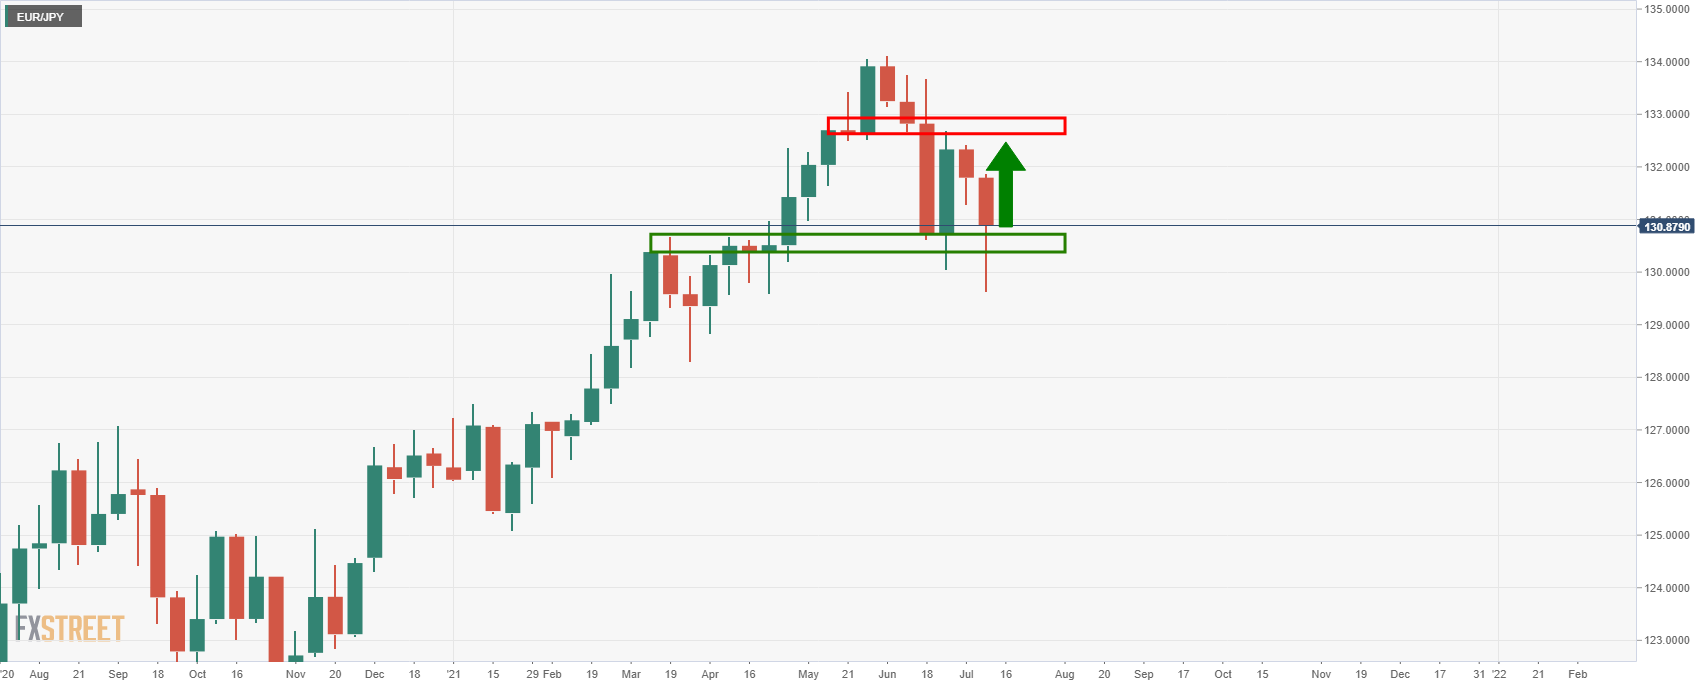
The weekly chart does not quite agree yet.
The support is holding, and a subsequent upside test can be expected for the week ahead.
EUR/JPY daily chart
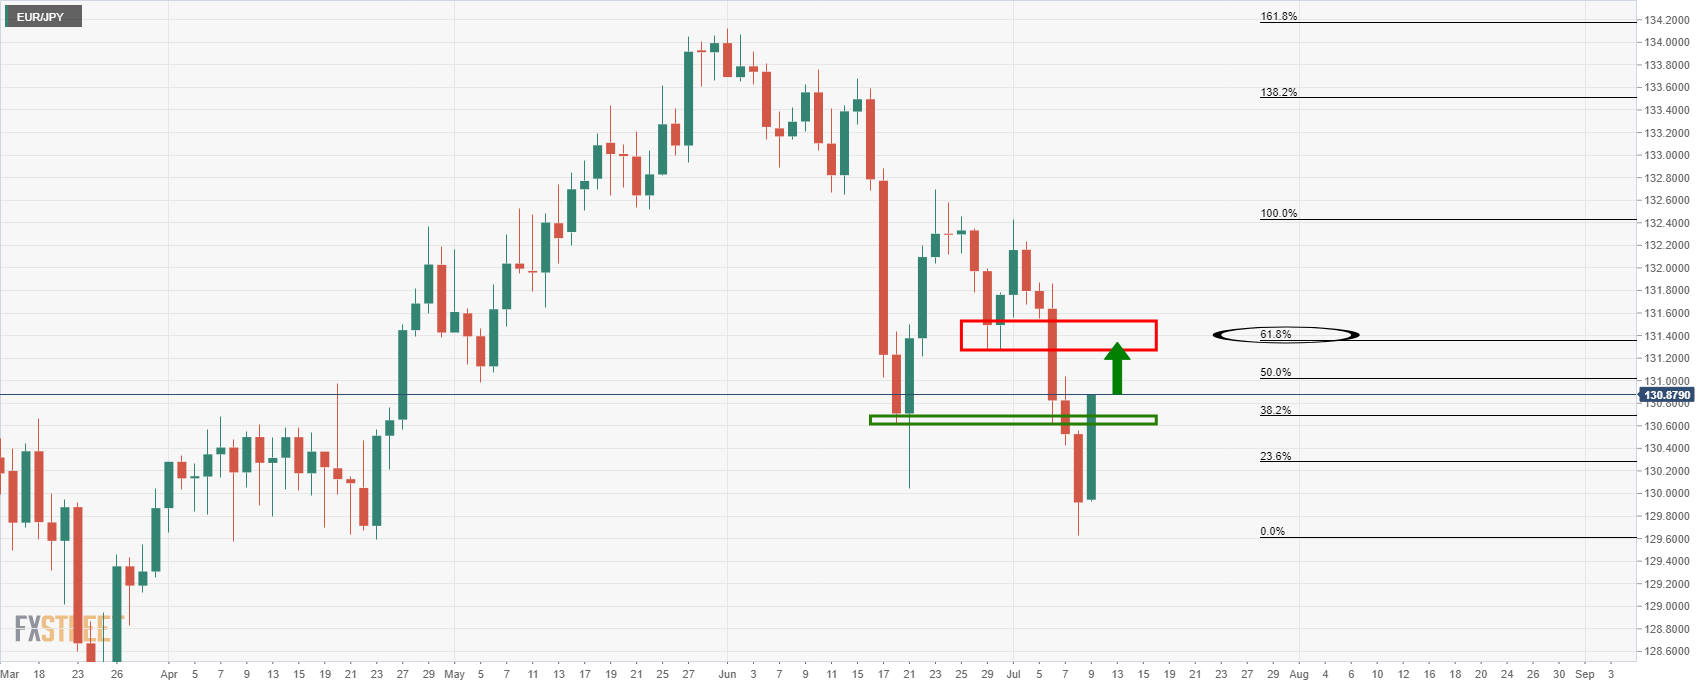
From a daily perspective, the price has already penetrated the prior support structure that was expected to have turned into resistance around the 38.2% Fibo.
Instead, the price could lean on this area as a support structure and head higher for a deeper test of the bear's commitments on the daily bearish impulse.
There would be prospects of a test of the neckline of the M-formation and the 131.20s.
Looking across the USD/JPY and EUR/USD charts, there are also prospects there to support the bullish bias for the near term.
USD/JPY daily chart
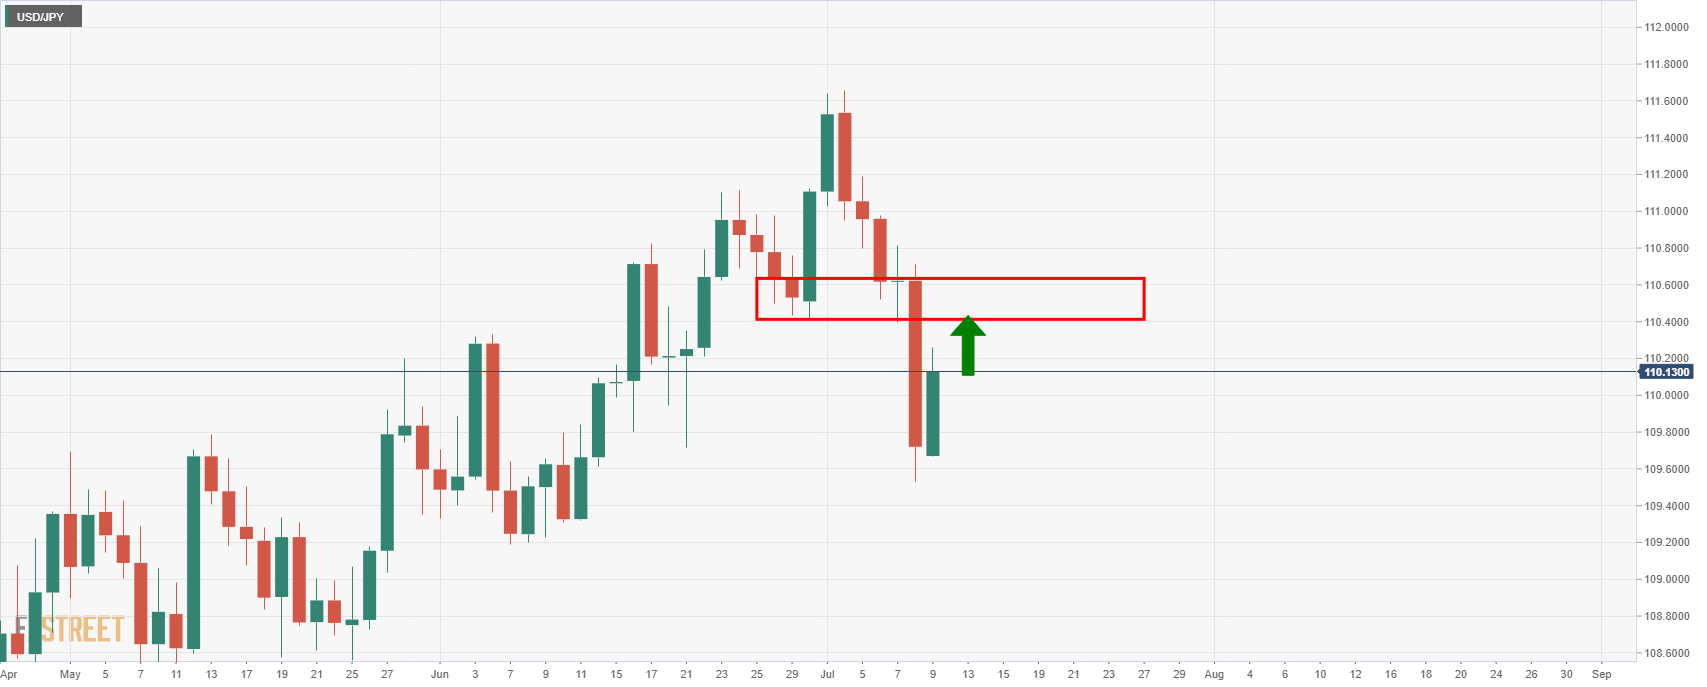
Bulls could be headed for a restest of the old support near 110.40/50.
In doing so, that would support the bearish case for the yen and the bullish case for EUR/JPY.
EUR/USD daily chart
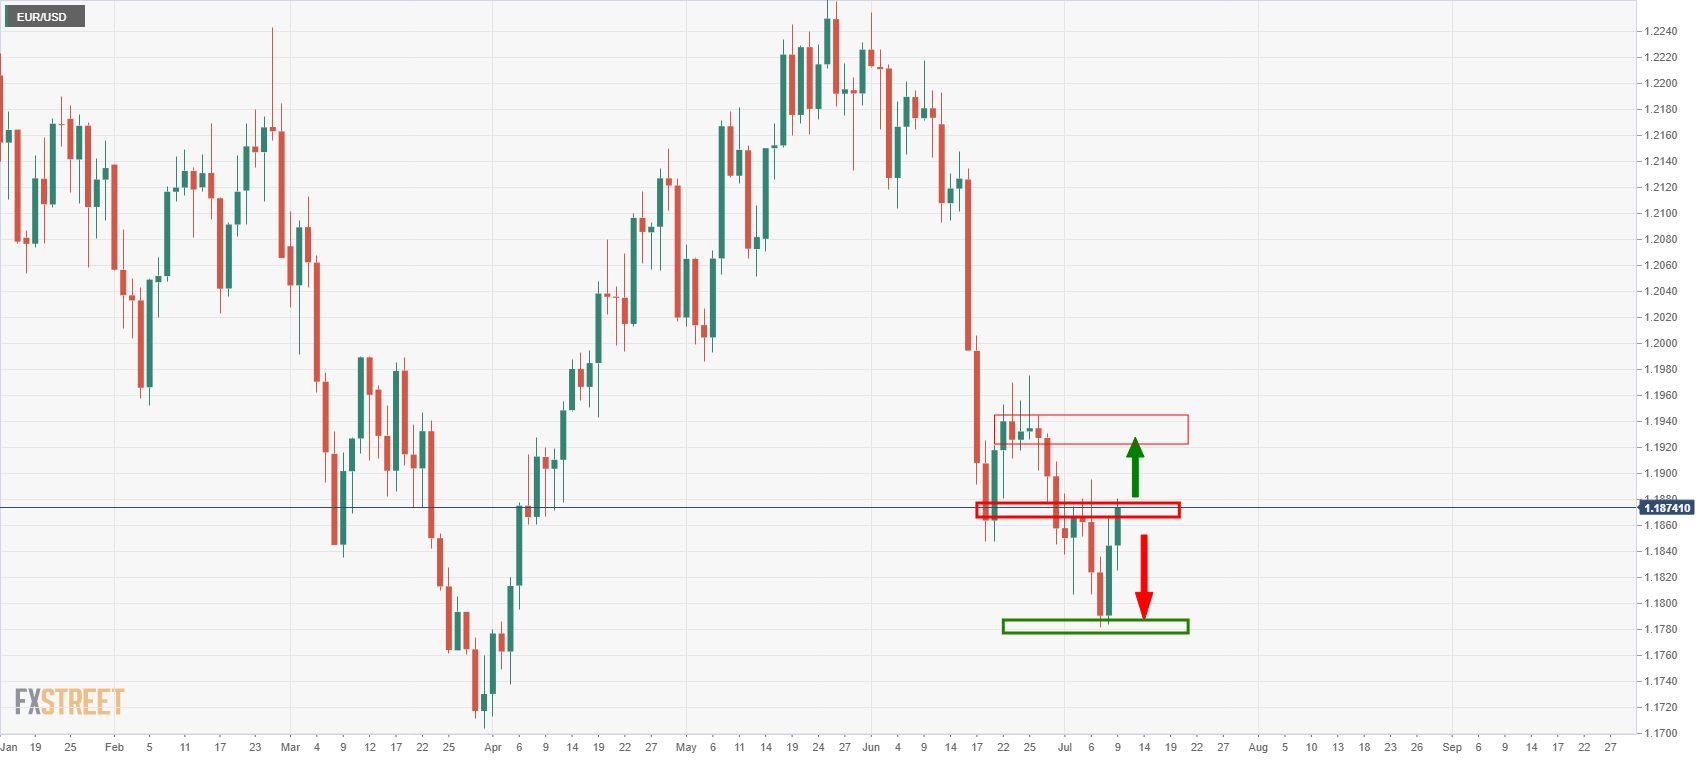
EUR/USD is at a crossroads here.
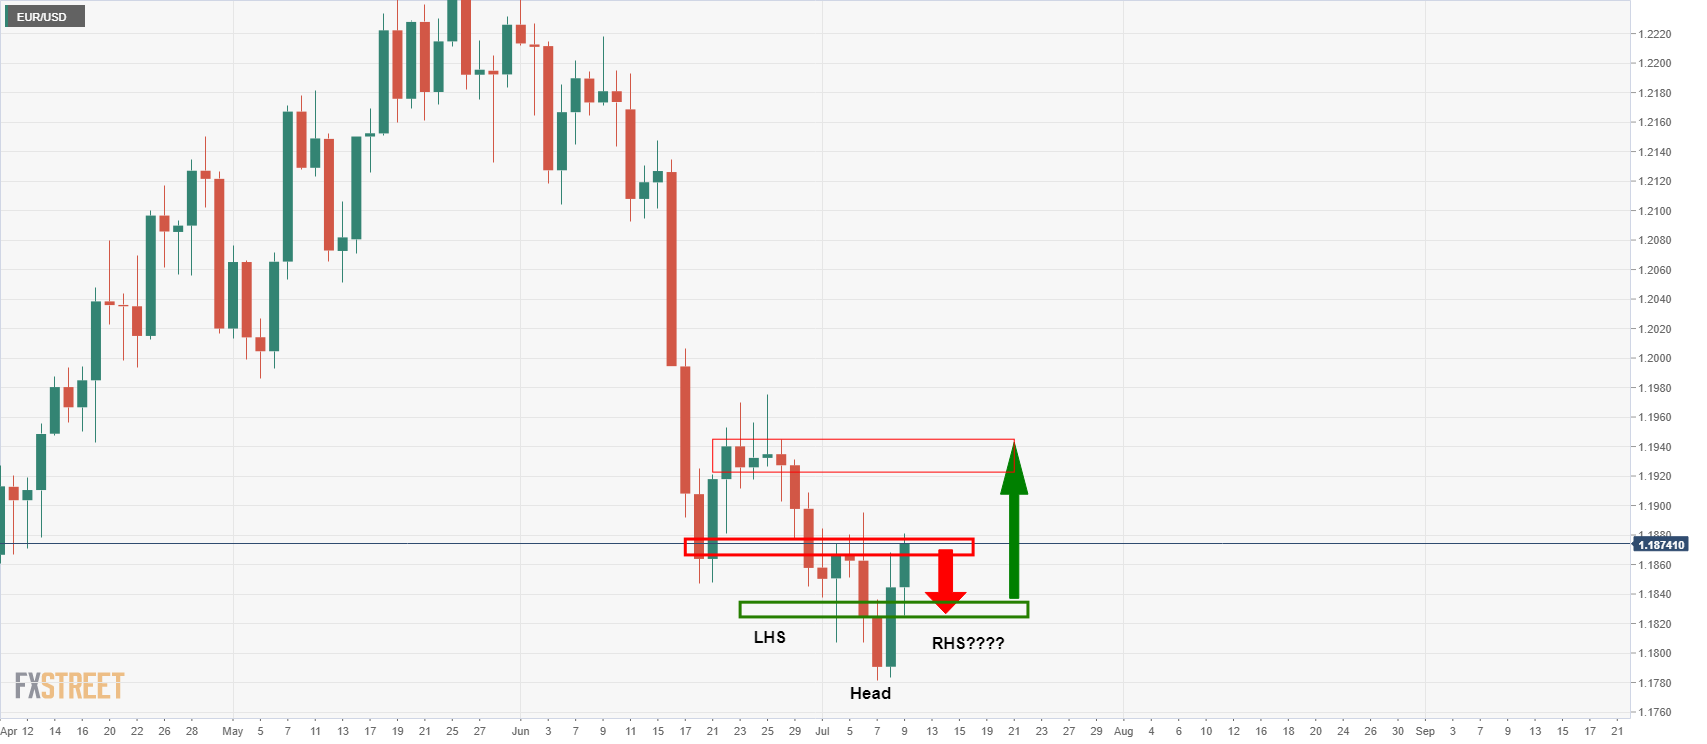
However, if meanwhile there is a bearish turn to the upside correction, then a case could be made for a bullish reverse head-and-shoulders that would ultimately support a bullish view for EUR/JPY for the latter part of the week ahead.
EUR/USD hourly chart
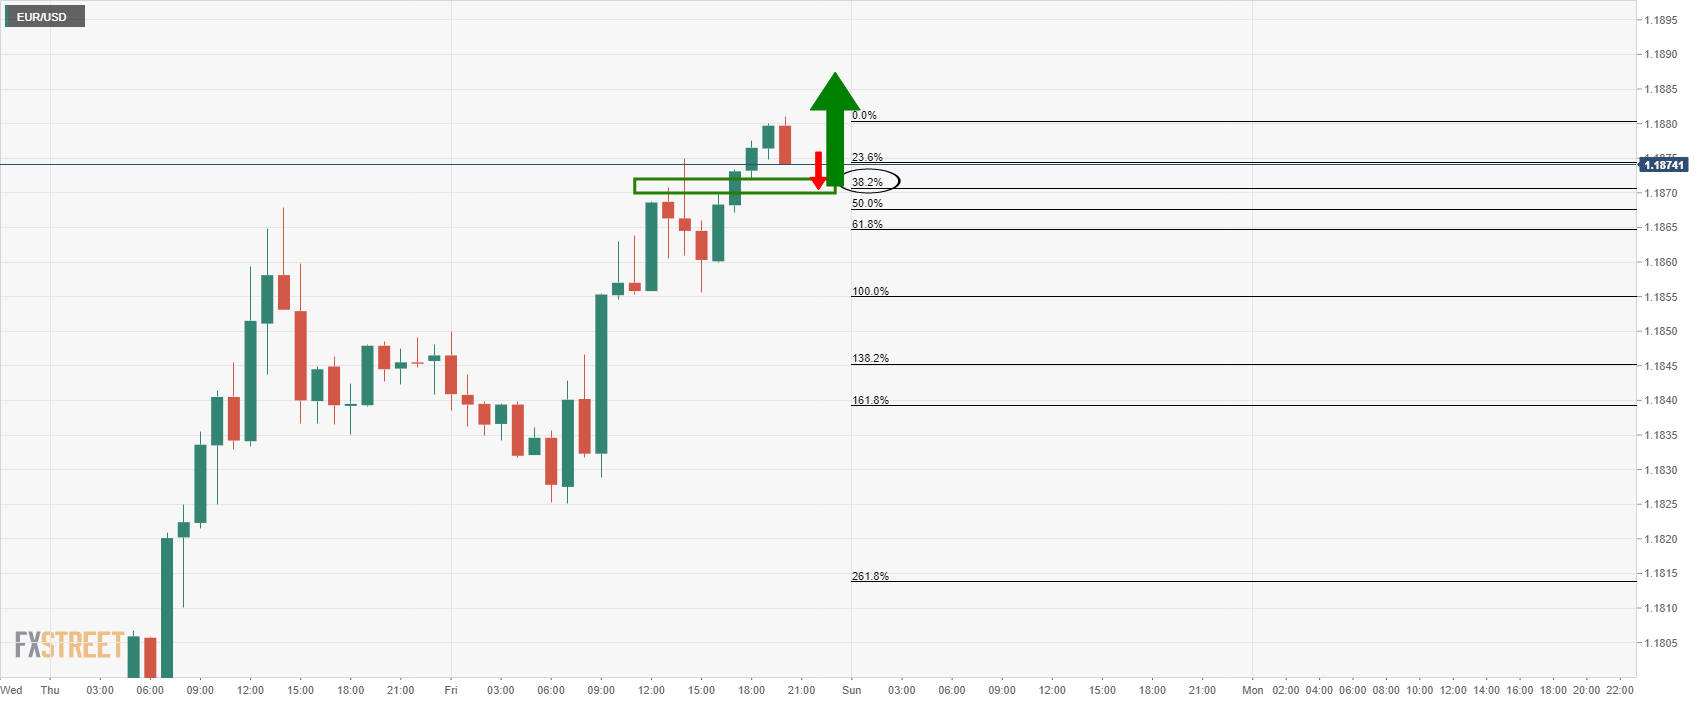
With that being said, the hourly chart is showing bullish prospects on a retest of 1.1870s and a 38.2% Fibo retracement that has a confluence with support.
A subsequent onward journey would support the immediate probabilities of a retest of the daily M-formation's neckline in the cross.
The bullish structure can be monitored on an hourly basis in the crisis as follows:
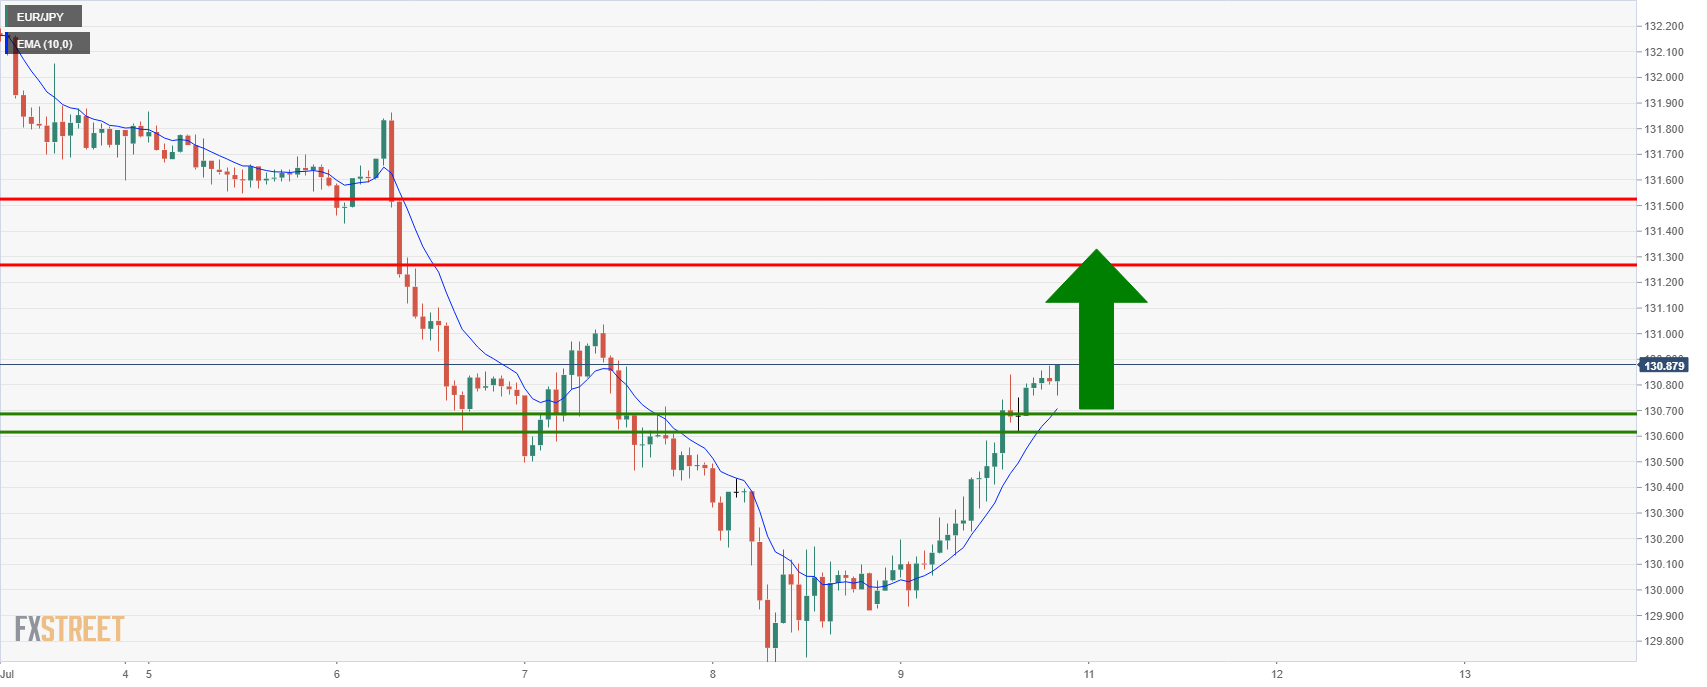
With the price holding above support and the 10-EMA, bulls can look to engage for the start of the week and target the 131.30/50s.
Premium
You have reached your limit of 3 free articles for this month.
Start your subscription and get access to all our original articles.
Author

Ross J Burland
FXStreet
Ross J Burland, born in England, UK, is a sportsman at heart. He played Rugby and Judo for his county, Kent and the South East of England Rugby team.


