|

Chart of The Week: AUD/JPY in a precarious position at daily support

  • AUD/JPY in focus as market uncertainty weighs.
  • Bears lining up with their entry signals at the ready.

We gravitate to the usual suspects at times of geopolitical uncertainty. The weekend headlines put the US and Chinese tensions at the forefront of markets. More on that here: China's plan of national security law in Hong Kong puts Trump in an unwelcome spot with Xi

Besides fundamentals, the market's risk barometer is already compelling due to its technical stance on the charts. AUD/JPY is ripening for a short but there could be a last breath from the bulls at daily support.

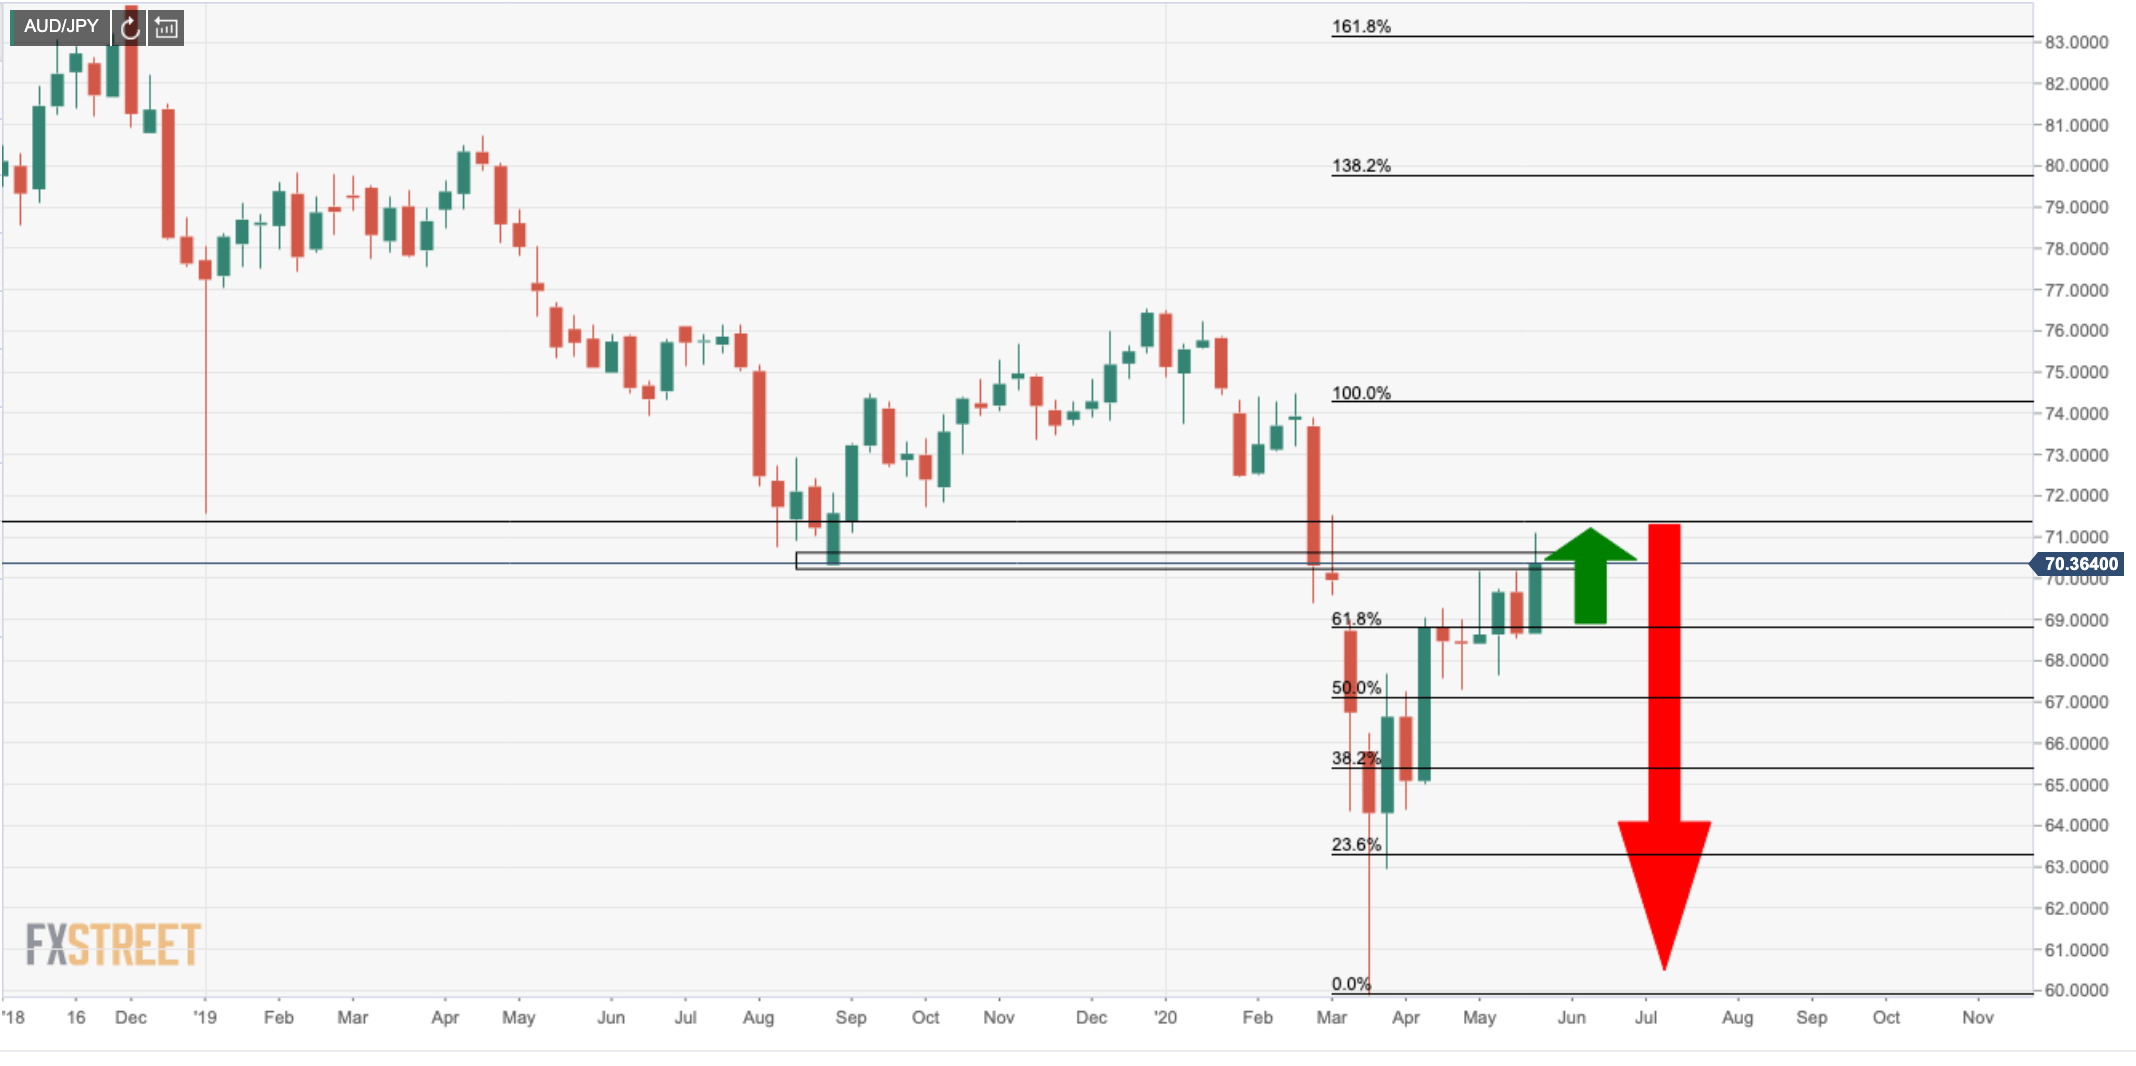
The 78.6% Fibonacci retracement could well be tested fully before bears take over. On the other hand, a risk-off open this week could set the stage for the making of a new bearish market and an impulse destined into a 67 handle target. 

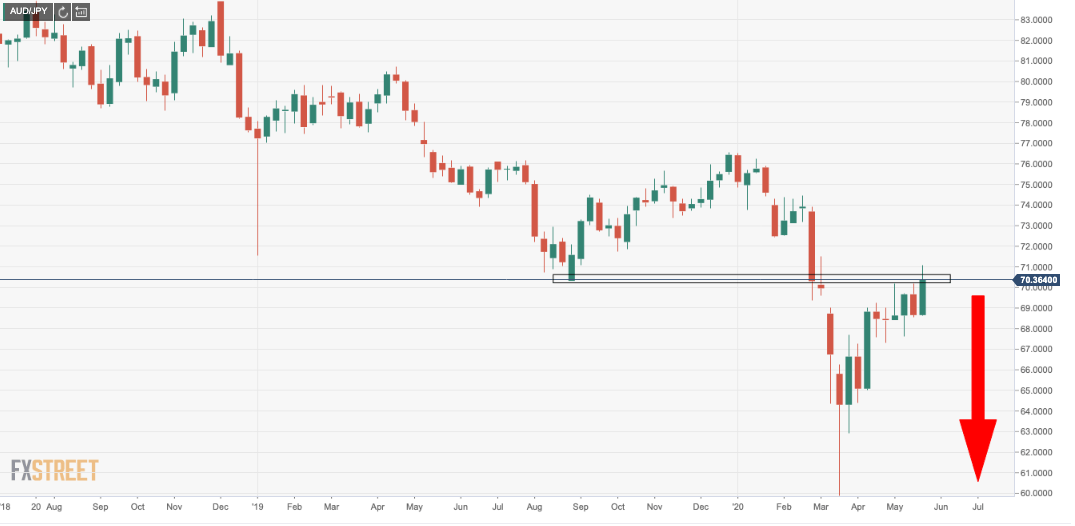
The weekly chart shows the  bearish trend:

Fibonacci retracements of 78.6% has a confluence with Dec 2019 lows:

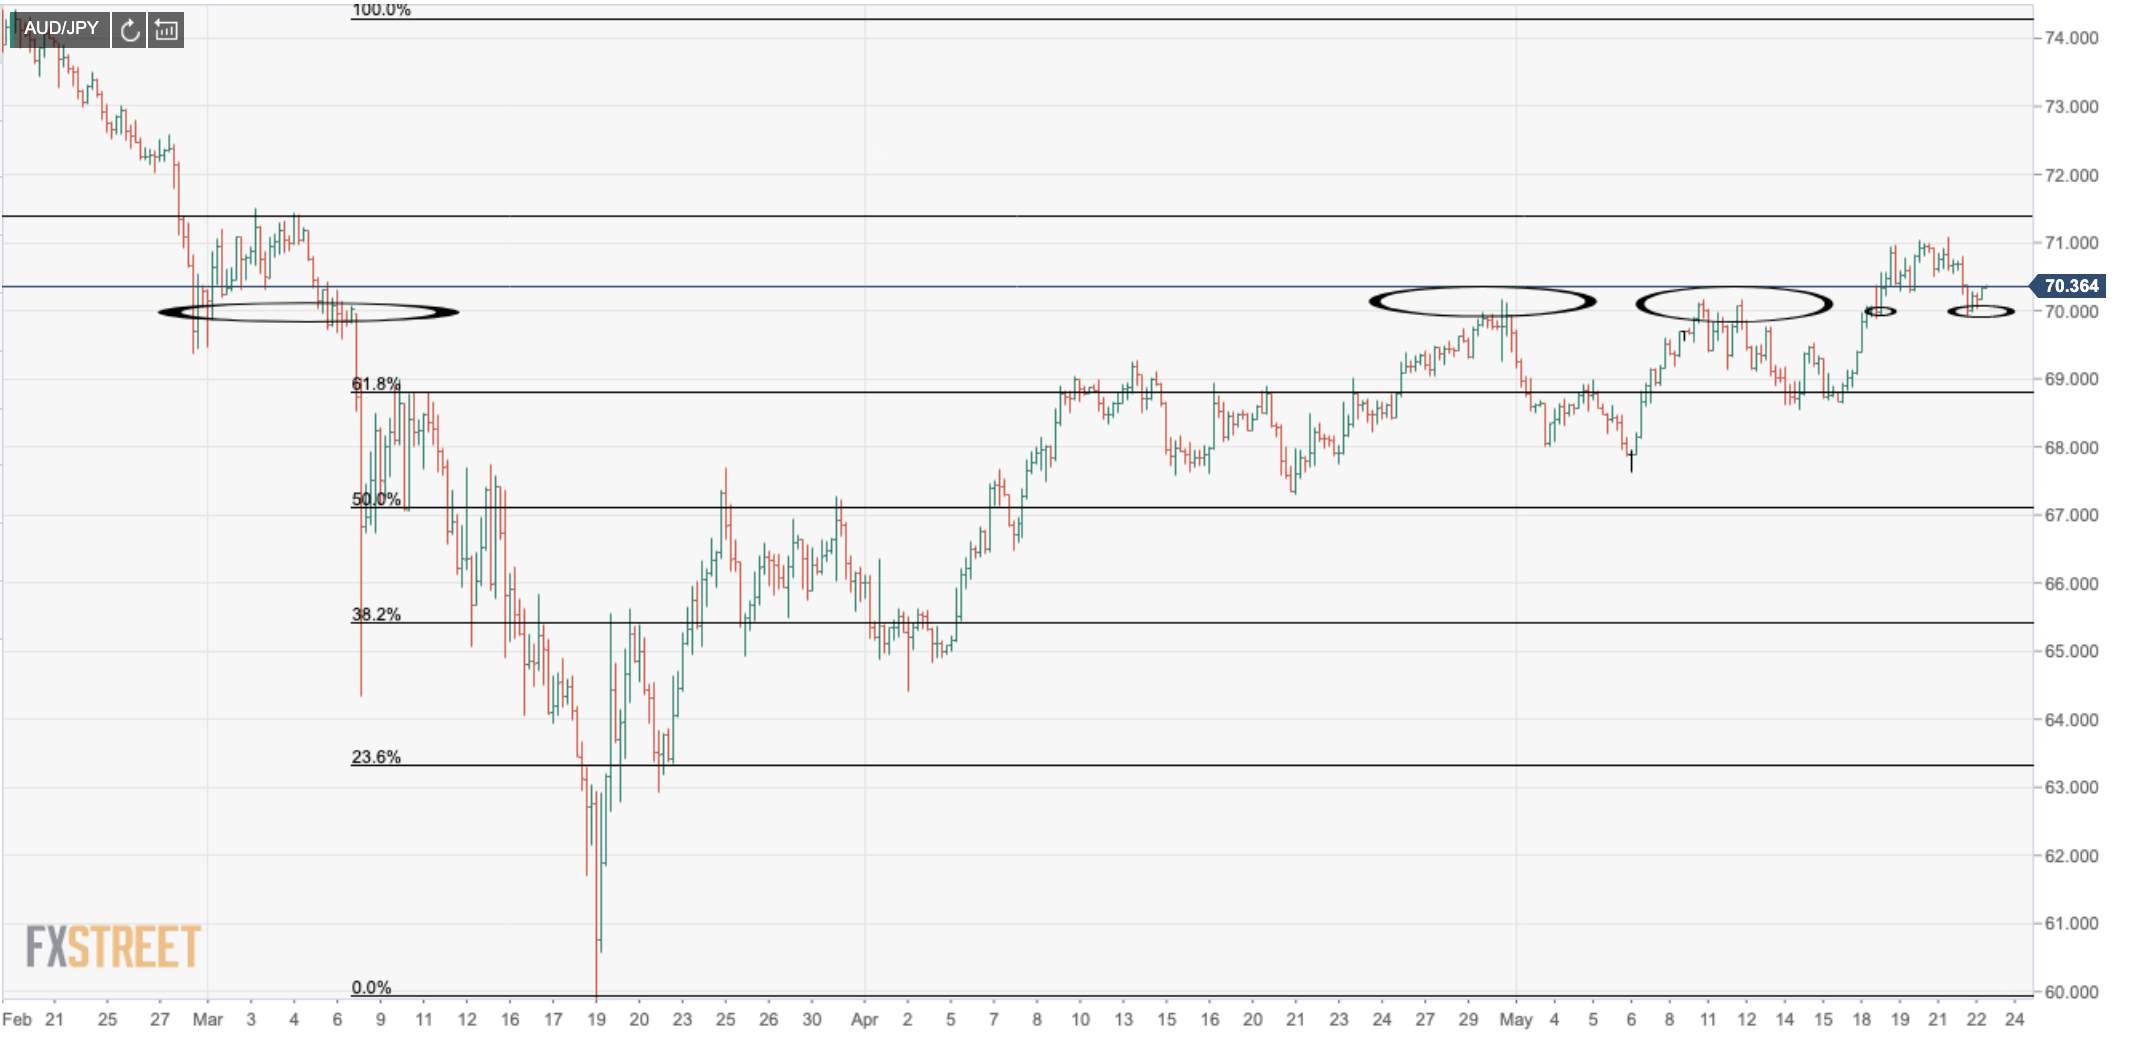
The daily charts show daily support and resistance area...
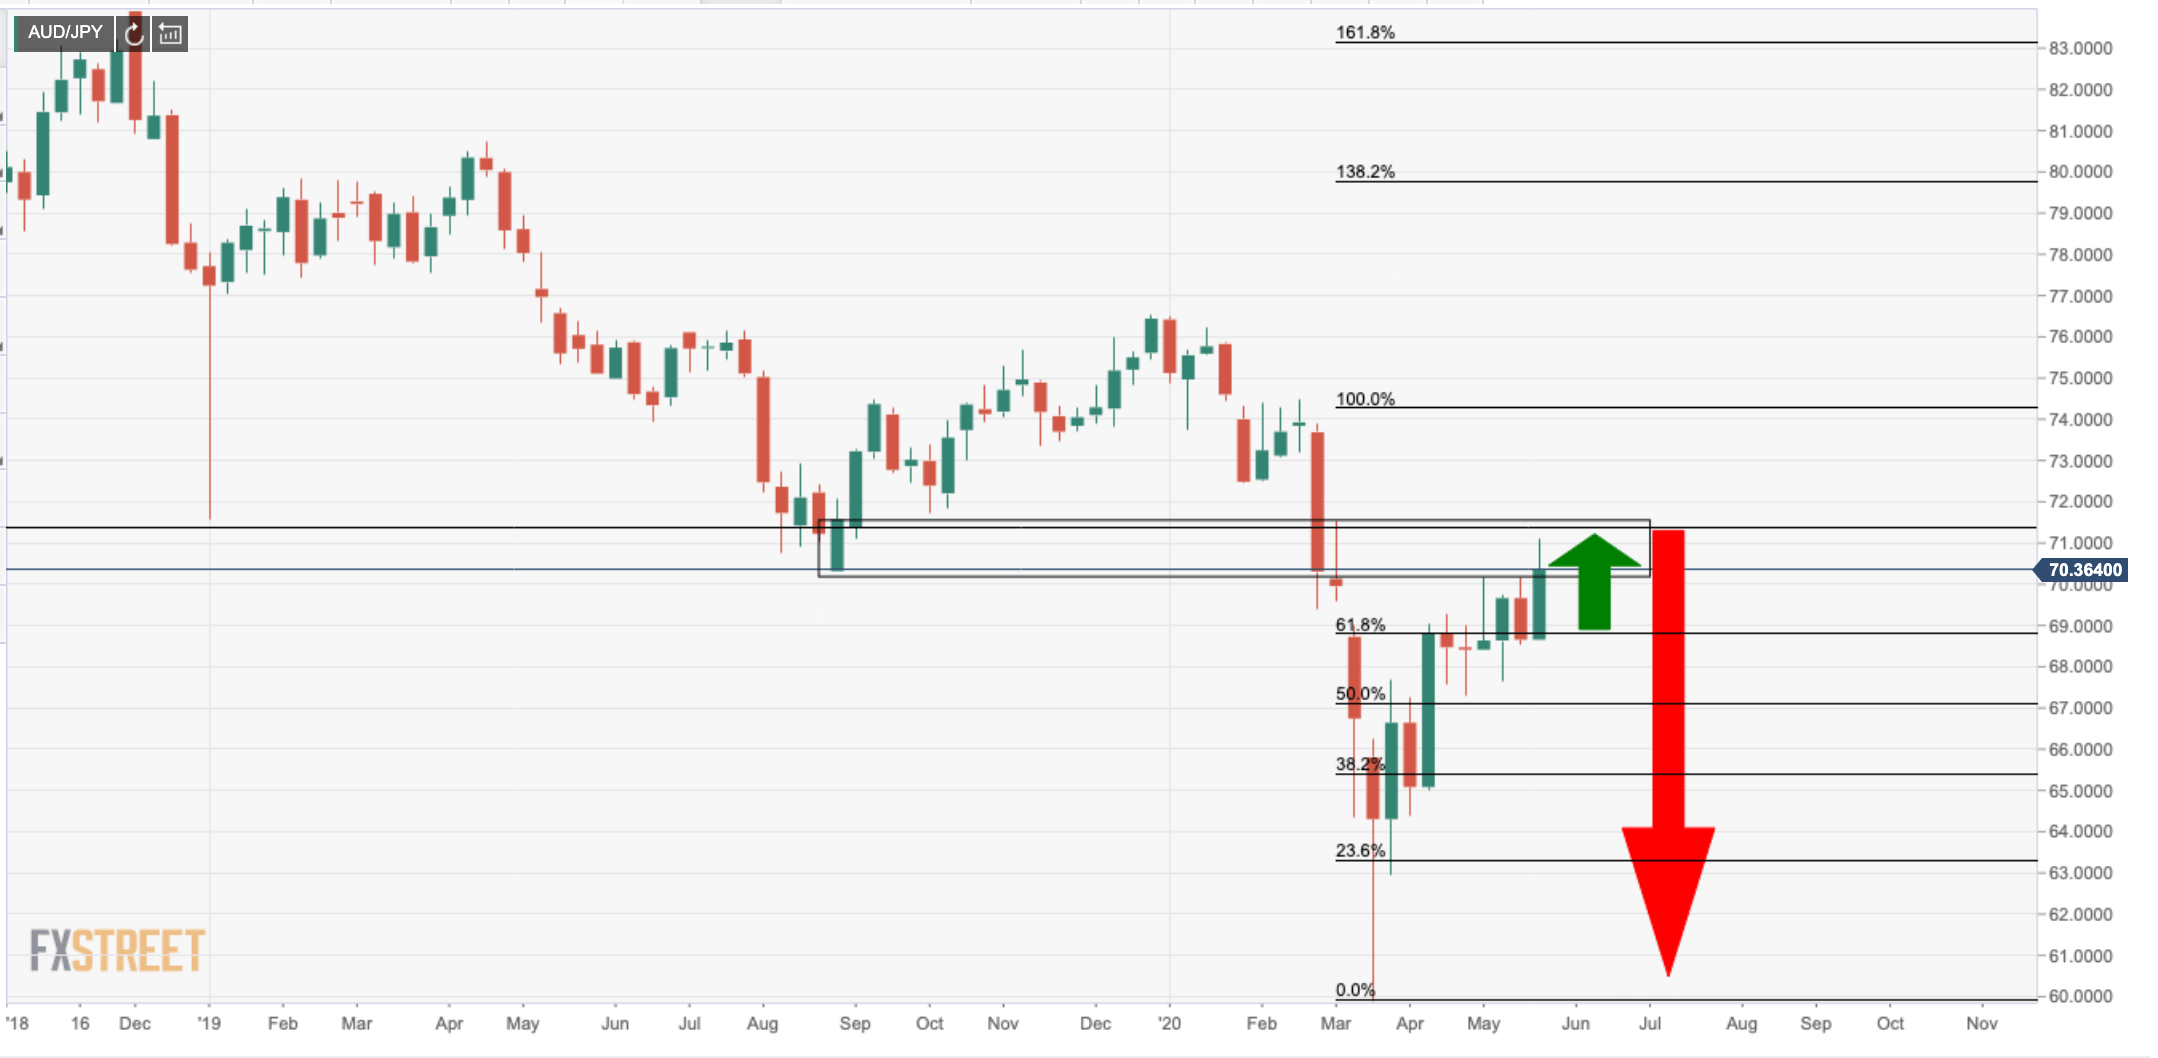
... and here:

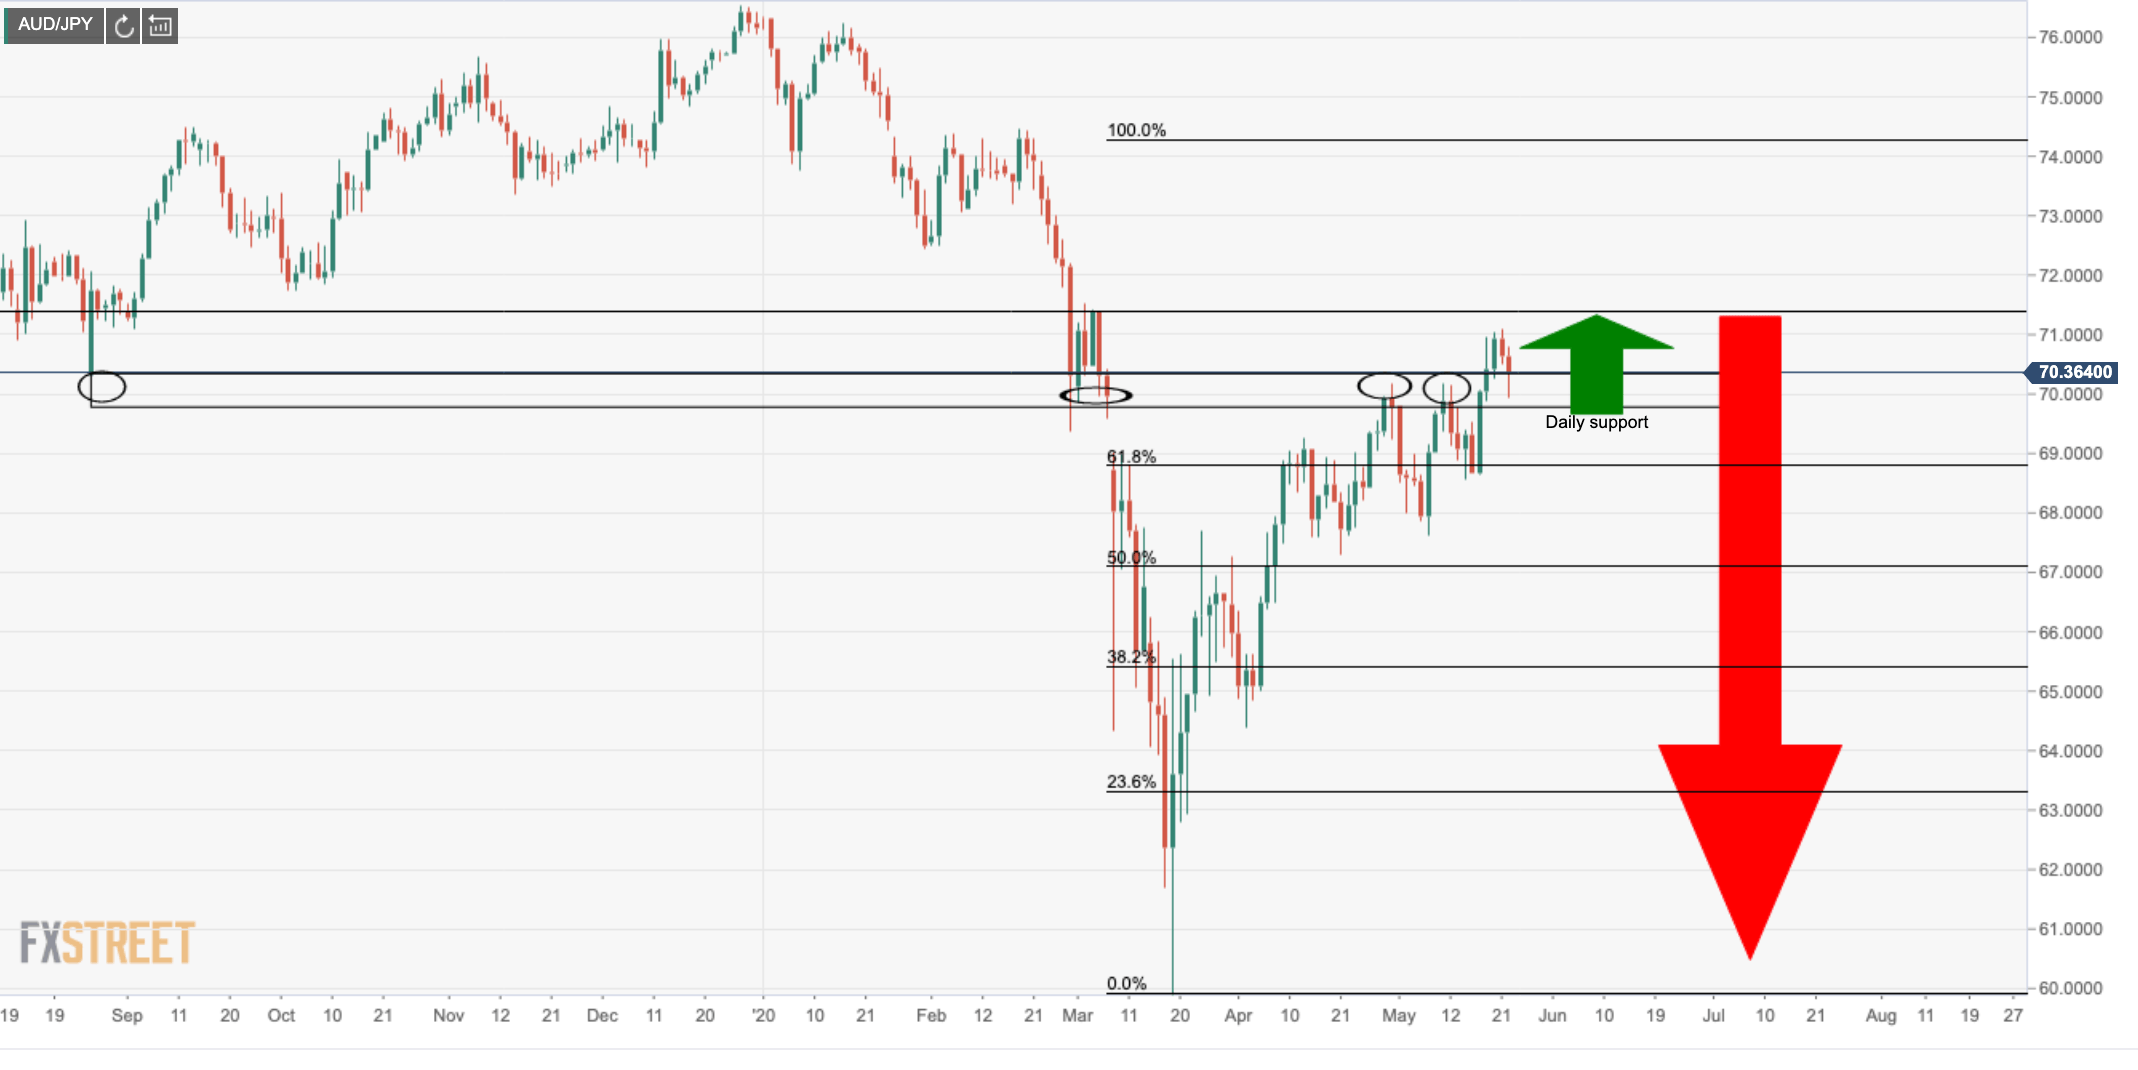
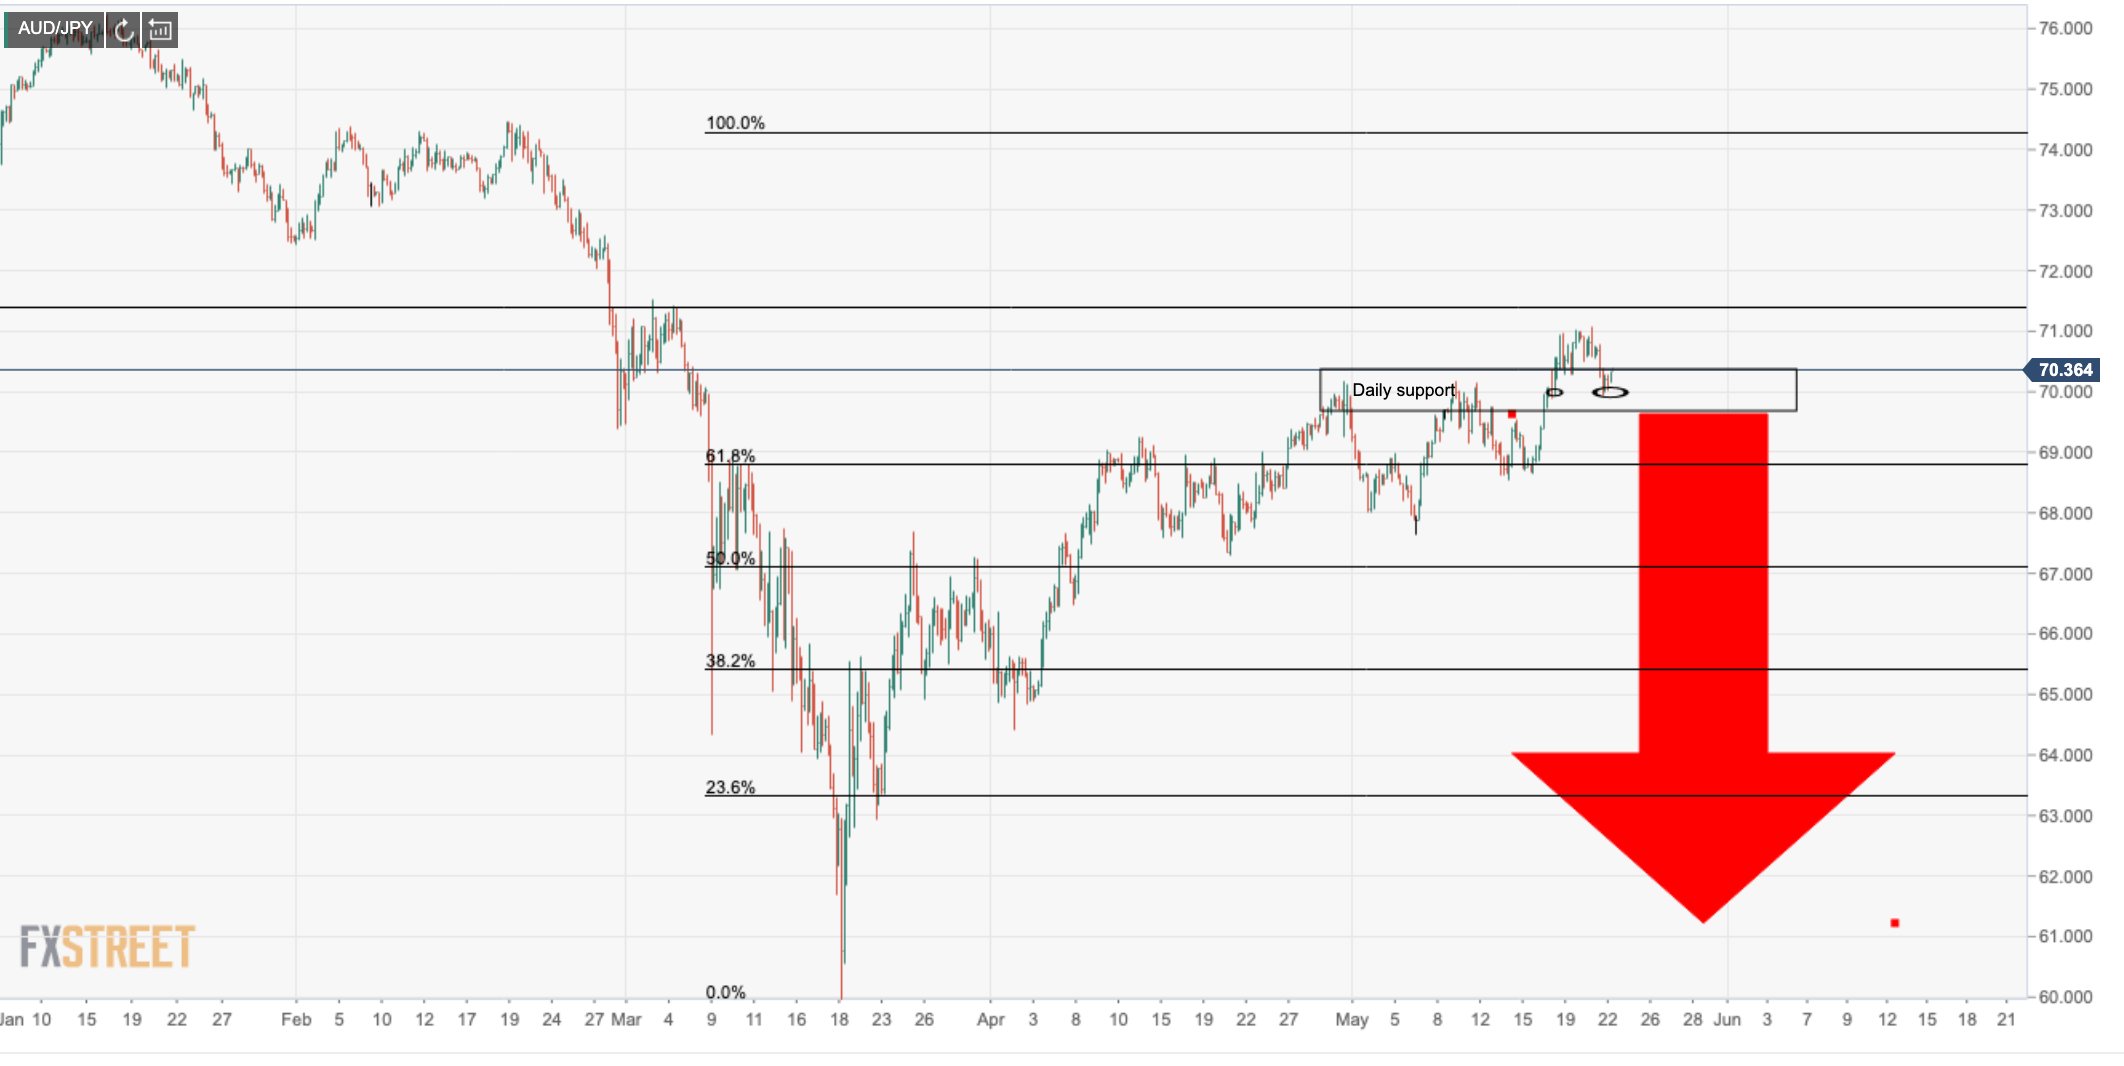
The 4 HR time frame shows price reacting to the daily support structure:

A break below daily support opens the case for lower:

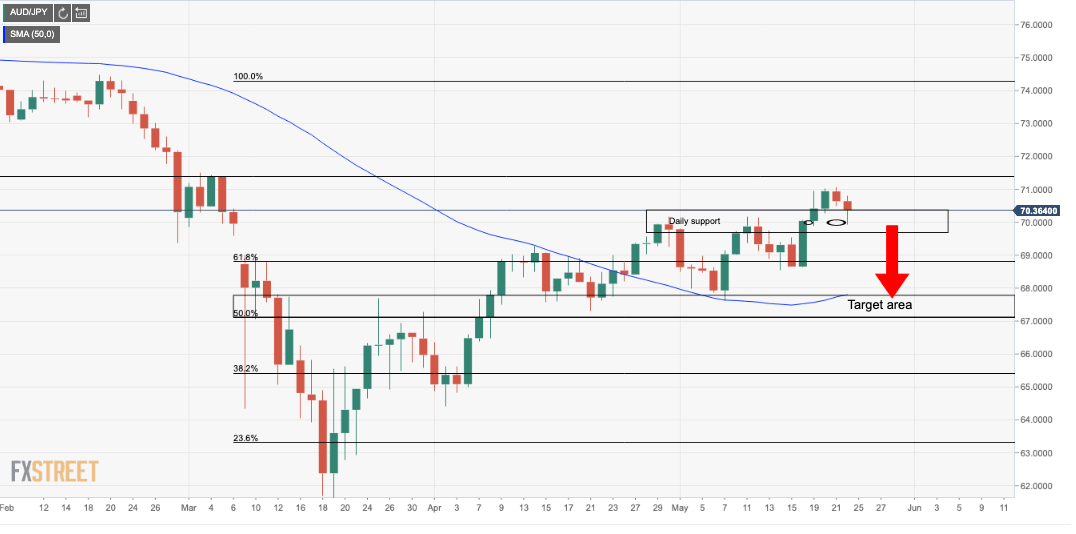
Bears can target a 50-day moving average, prior support and resistance structure, with the confluence of a negative 61.8% Fib of prior bullish impulse:

Author

Ross J Burland

Ross J Burland, born in England, UK, is a sportsman at heart. He played Rugby and Judo for his county, Kent and the South East of England Rugby team.

More from Ross J Burland
Share:

Markets move fast. We move first.

Orange Juice Newsletter brings you expert driven insights - not headlines. Every day on your inbox.

By subscribing you agree to our Terms and conditions.

Editor's Picks

EUR/USD: Bulls pray for a dovish Fed

EUR/USD has finally taken a breather after a pretty energetic climb. The pair broke above 1.1680 in the second half of the week, reaching its highest levels in around two months before running into some selling pressure. Even so, it has gained almost two cents from the late-November dip just below 1.1500 the figure.

GBP/USD trims gains, recedes toward 1.3320

GBP/USD is struggling to keep its daily advance, coming under fresh pressure and retreating to the 1.3320 zone following a mild bullish attempt in the Greenback. Even though US consumer sentiment surprised to the upside, the US Dollar isn’t getting much love, as traders are far more interested in what the Fed will say next week.

Gold: Bullish momentum fades despite broad USD weakness

After rising more than 3.5% in the previous week, Gold has entered a consolidation phase and fluctuated at around $4,200. The Federal Reserve’s interest rate decision and revised Summary of Economic Projections, also known as the dot plot, could trigger the next directional move in XAU/USD. 

Week ahead: Rate cut or market shock? The Fed decides

Fed rate cut widely expected; dot plot and overall meeting rhetoric also matter. Risk appetite is supported by Fed rate cut expectations; cryptos show signs of life. RBA, BoC and SNB also meet; chances of surprises are relatively low. Dollar weakness could linger; both the aussie and the yen best positioned to gain further. Gold and oil eye Ukraine-Russia developments; a peace deal remains elusive.

Week ahead – Rate cut or market shock? The Fed decides

Fed rate cut widely expected; dot plot and overall meeting rhetoric also matter. Risk appetite is supported by Fed rate cut expectations; cryptos show signs of life. RBA, BoC and SNB also meet; chances of surprises are relatively low.

Ripple faces persistent bear risks, shrugging off ETF inflows

Ripple is extending its decline for the second consecutive day, trading at $2.06 at the time of writing on Friday. Sentiment surrounding the cross-border remittance token continues to lag despite steady inflows into XRP spot ETFs.