Chart Of The Week: USD/CAD's 50% mean reversion target, 1.3060s
- USD/CAD bearish technical set-up for the week ahead.
- 61.8% Fibo target reached and bears looking for bearish continuation.
- Bearish pin-bar to trendline support reinforces bearish bias.
- Below 1.3080, the 50% mean reversion of the latest swing range at 1.3060 is in focus.
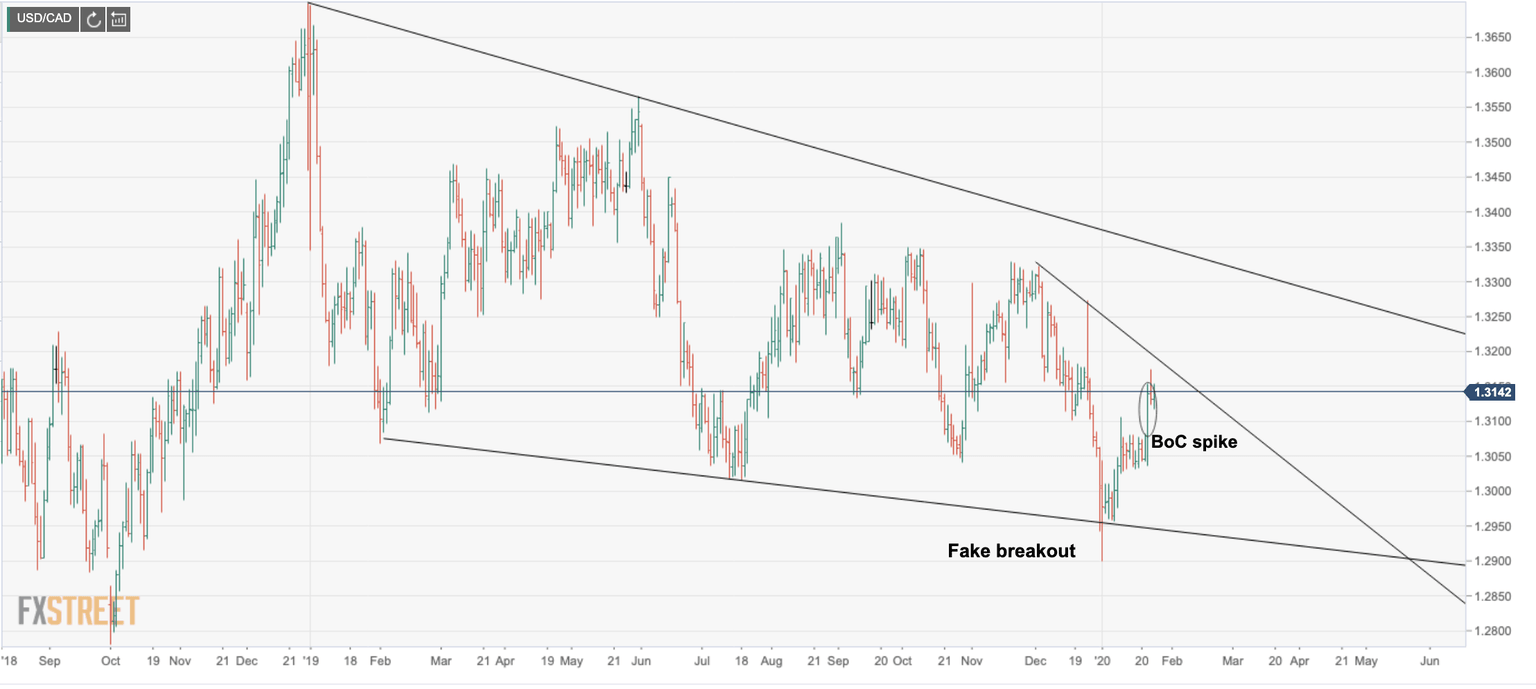
USD/CAD BoC spike following fake-breakout
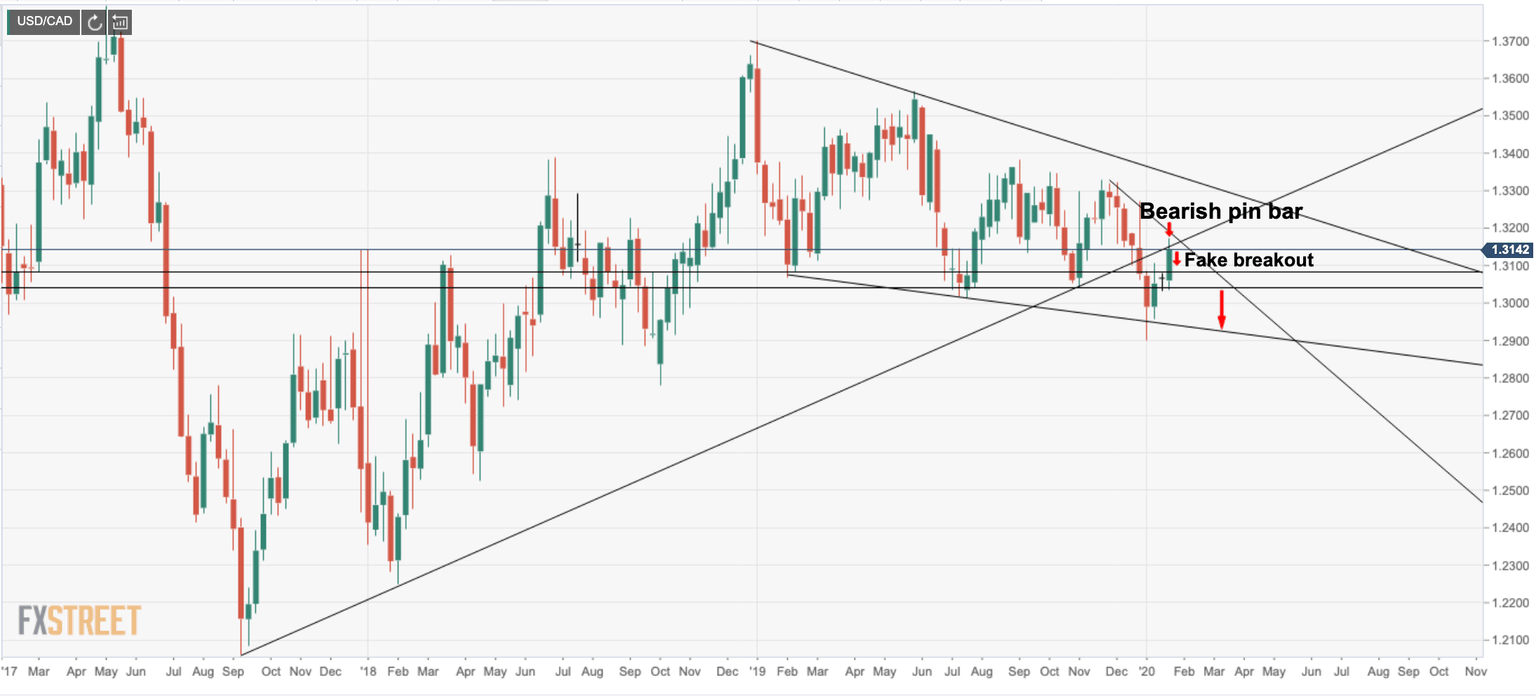
USD/CAD daily chart and possible downside continuation set-up

USD/CAD weekly chart confirms the downside bias below daily trend support
61.8% Fibonacci reached, reinforces downside bias
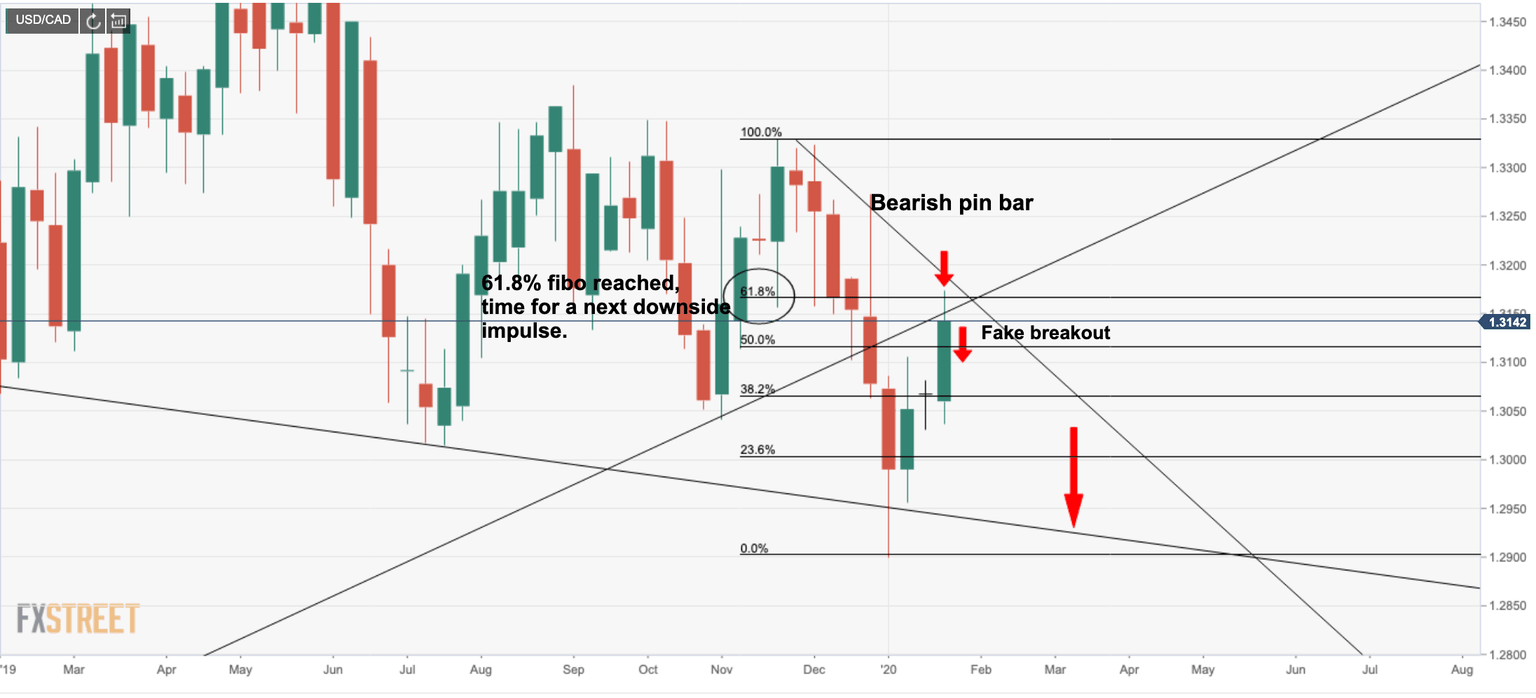
50% mean reversion the cards on break of 1.3080 support

The USD/CAD chart favours a bearish bias following a series of technical developments on the daily and weekly chart. The US dollar of late has been firmer and the dovish switch-up at the Bank of Canada ignited a spike to the upside, taking out stops along the way. While a run of weak Canadian domestic economic data has shifted focus to concerns about the Canada-specific growth backdrop, there will be a ken focus on this week's November Canadian GDP.
While the BoC may be on the verge of a rate cut this quarter, perhaps in April, economic data is known to be volatile for Canada. Considering the likelihood of a pullback, we could expect a 50% mean reversion to said support while we wait and see what comes of the GDP at the end of the week. An unchanged GDP would leave Q4 tracking near the BoC's latest projections (0.3%) and may not rock the boat too much. A neutral Fed with a twist of dovishness will likely weigh on the US dollar with 97.00/35 support targets in focus on a downside correction.
Author

Ross J Burland
FXStreet
Ross J Burland, born in England, UK, is a sportsman at heart. He played Rugby and Judo for his county, Kent and the South East of England Rugby team.


