Can equities hold up amidst renewed negative risk appetite across markets? [Video]
![Can equities hold up amidst renewed negative risk appetite across markets? [Video]](https://editorial.fxstreet.com/images/Markets/Equities/iStock_000017292947_Large_XtraLarge.jpg)
Market Overview
The momentum of positive sentiment arising from the enormous $2 trillion support package agreed in Congress last week has already begun to wane. With renewed selling pressure, the nascent recovery of risk appetite is already being tested. Focus has turned back to the continued worsening of the spread in Coronavirus and just how long economies will have stringent lockdown measures in place in order to restrict the damage to their populations. After a weekend of sobering headlines of the prospect of months of lockdowns and subsequent social distancing, traders and investors are having to price for the potential that it could be deep into Q3 or perhaps even Q4 before any semblance of normality is restored (and that is without the prospect of a second wave of Coronavirus). There is subsequently a sense of caution and risk negative bias across asset classes today. Treasury yields are lower (especially the 10 year) whilst the dollar is also gaining ground on everything in the majors aside from the yen. Silver is lower and the oil price is diving again. The one anomaly comes in equities, which are holding ground today, perhaps with even marginal gains. Can this continue though, with pretty much everything else pointing to a negative session? It will be hard for the bulls to resist.
Wall Street broke the sequence of recovery sessions as it closed lower on Friday, with the SP 500 3.3% at 2541. US futures are mildly higher early today (although fluctuating significantly) at +0.5%. This has restricted selling pressure through Asian markets (Nikkei -1.6% and Shanghai Composite -0.9%). European indices are looking positive early today with FTSE Futures +0.5% and DAX Futures +1.1%. In forex, USD and JPY are the standout performers, both around half a percent stronger across the major pairs. In commodities, there is a sea of red, with silver and oil both around -4% lower. Gold is not as bad but still around half a percent off.
There is a whole raft of Eurozone sentiment data for March on the economic calendar this morning for traders to gauge the outlook for the region’s economic growth prospects, all coming at 1000GMT. Remember that the European’s had their daylight savings time shift over the weekend which means that everyone is now back in sync with their data announcements. The Eurozone Economic Sentiment is expected to slide sharply to 91.8 (from 103.5 in February) which would be the lowest since August 2013. Eurozone Industrial Sentiment is expected to drop to -12.9 (from -6.1 in February) which would be the lowest reading since late 2012. Furthermore, Eurozone Services Sentiment is expected to decline to -3.4 (from +11.2in February) which would be the lowest since August 2013. German inflation readings are released on a state level throughout the day and the national level for German HICP is at 1300GMT and is expected to growth by +0.1% in the month of March which would pull the year on year reading down to +1.4% from +1.7% in February. US Pending Home Sales are at 1500GMT and are expected to decline by -1.3% in February (after growth of +5.2% in January).
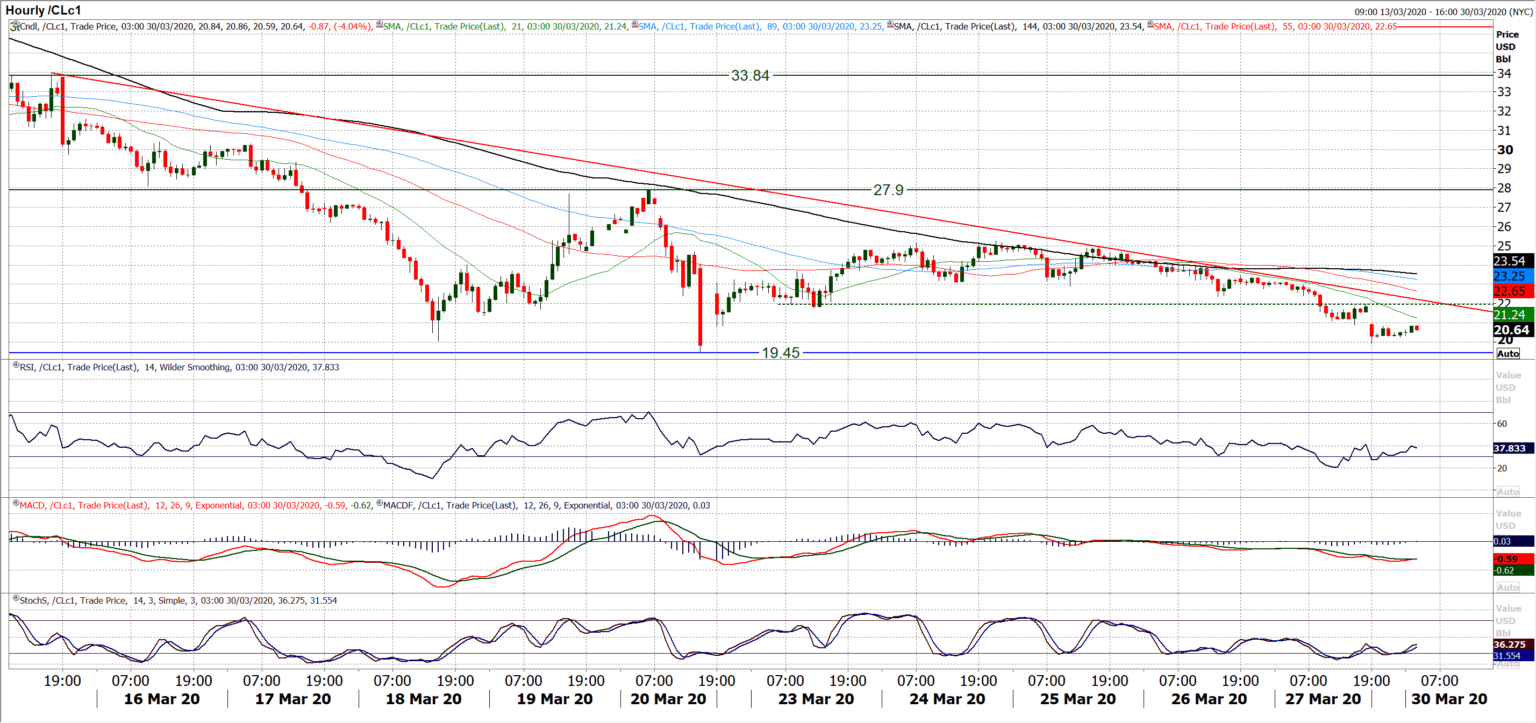
Chart of the Day – NZD/USD
We continue to look at the commodity currencies as playing out a significant rally against the dollar. This shows strongly in the chart of the Kiwi. A succession of bull candles and intraday weakness being bought into. This has developed a significant rally in the past week with a run of six consecutive positive closes. Furthermore a recovery uptrend is strengthening. Momentum on the daily chart shows RSI at multi week highs, Stochastics rising strongly and as of Friday a bull cross on MACD. The rebound is also taking consideration of the Fibonacci retracements of the big $0.6755/$0.5470 sell-off. The 23.6% Fib was a basis of support at $0.5770 which forms a key higher low now, whilst breaking above 38.2% Fib (at $0.5960) opens 50% Fib around $0.6110 as the next recovery target. However it is on the hourly chart where the technicals really come alive, with the breakout above $0.5910 becoming a neckline for a recovery base pattern. The pullback used this as support almost to the pip on Friday and is now an increasingly key level. Intraday weakness is a chance to buy, with 40/45 on hourly RSI an area where the buyers are interested. The 89 hour moving average is also worth watching as a good gauge and a basis of support, coming in this morning around the $0.5910 support. Renewed buy signals on hourly MACD and Stochastics also leave the bulls well positioned into the new week. The next resistance of note is an old pivot at $0.6160/$0.6200.
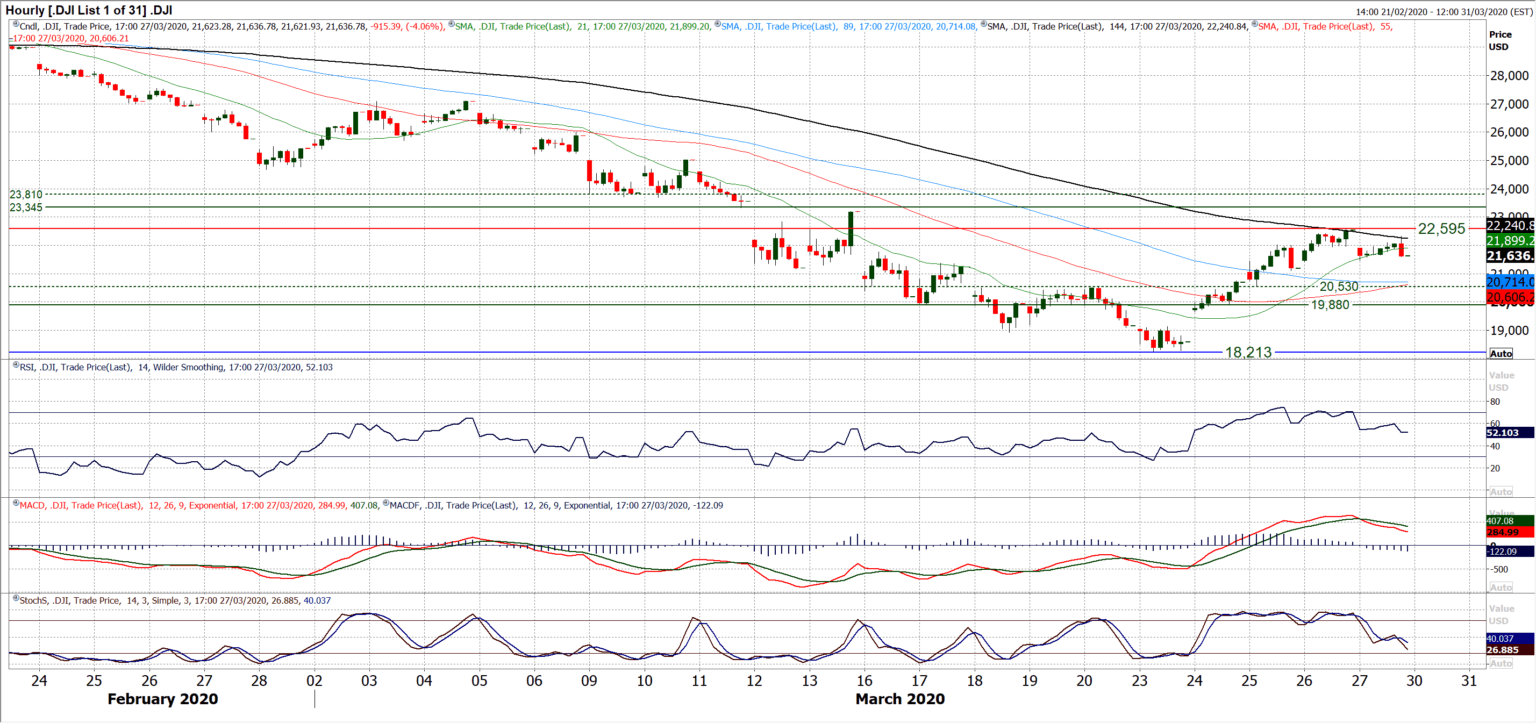
WTI Oil
The bears are decisively back in control of oil once more as the price builds renewed downside momentum. Friday’s gathering selling pressure formed a second consecutive solid negative candle in a row and the multi-year low at $19.45 is wide open once more (if Brent Crude is anything to go by then this level is certainly under pressure). Intraday rallies are failing at lower levels now, and a downtrend of the past two weeks is now leaving lower highs. The hourly chart shows this all very well with momentum indicators once more significantly negatively configured to suggest that even intraday rallies are a chance to sell. There is now resistance is forming between $22.00/$22.40 which is a near term sell-zone around the downtrend this morning. Initial resistance is at $23.45 but a rally would need to realistically pull above $25.25 to suggest there is any serious potential of sustainability to a recovery.
Dow Jones Industrial Average
The recovery from the low on the Dow has been impressive, but now the bulls are seeing their first real test of strength. After a record three session climb, Friday’s negative session has put a fly in the ointment. The question is, how do the bulls now react? Friday’s candlestick was negative but has not given an outright sell signal. Also, the support of Thursday’s low has remained intact too. Into the new week, the bulls need to find the strength to prevent a second consecutive negative session. There is still an encouraging look to the improvement on momentum indicators, where Stochastics and MACD lines point higher. RSI holding back above will also help to maintain an improvement. The hourly chart shows that support at 21,470 is the first level to watch but the bulls holding above 21,100 is important as this is the first real higher low of the recovery. The key support to watch if the selling pressure does renew is the band 19.880,20,530 as a pivot for the recovery.
Other assets insights
EUR/USD Analysis: read now
GBP/USD Analysis: read now
USD/JPY Analysis: read now
GOLD Analysis: read now
Author

Richard Perry
Independent Analyst


