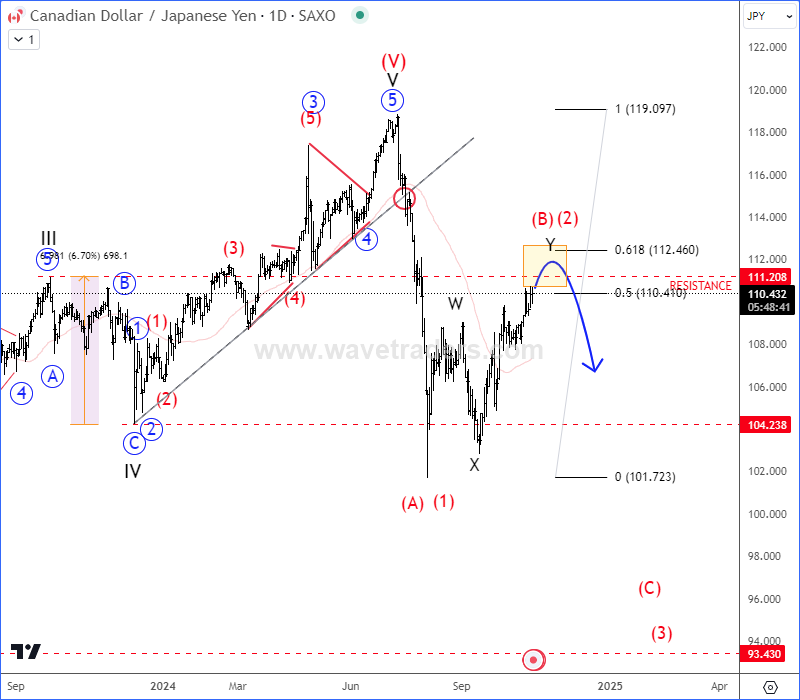
CAD/JPY is finishing a corrective rally

CADJPY has been in strong rise this year, but we see five waves up from 2023 swing lows, that are now completed because of a strong drop through the trendline support. We see an impulse down for wave (A)/(1) that is completed, so more weakness can show up for wave (C) or (3) after a current corrective rally in wave (B)/(2) that can be still underway, but it can be approaching the end, as it’s nearing strong 110 – 112 resistance zone.
CAD/JPY daily chart
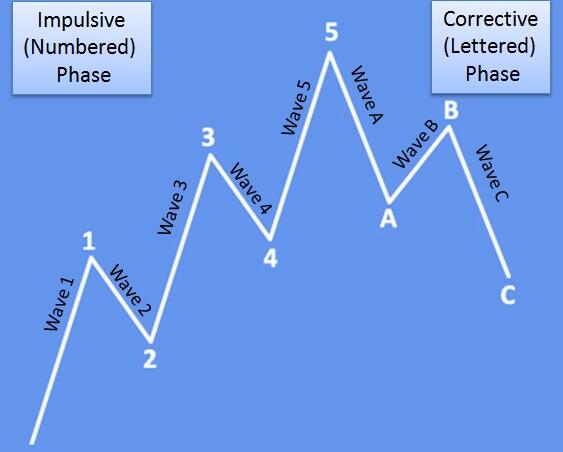
Basic Elliott Wave Pattern shows that after every five-wave impulse, we should be aware of a slow down in minimum three waves ABC or 123. So, when you recognize a change in the trend in a sharp or impulsive fashion for wave A/1, you have to expect more weakness for wave C/3 after a corrective retracement in wave B/2.
Basic Elliott Wave pattern
Get Full Access To Our Premium Elliott Wave Analysis For 14 Days. Click here.
Get Full Access To Our Premium Elliott Wave Analysis For 14 Days. Click here.
Author

Gregor Horvat
Wavetraders
Experience Grega is based in Slovenia and has been in the Forex market since 2003.


