Bitcoin– Correction completed! – Uptrend resumes!

Back in September of last year, 2017, we noted in our analysis of Bitcoin that its uptrend would last longer than most believe, that it would post higher highs for some time to come. More recently, last December, we forecast Bitcoin would undergo a healthy correction from its high of $19891.00 with minimum downside targets towards 8700.00+/-.
Well, we’ve read some horror stories from investors since, particularly over the last several days as prices have plummeted lower. Now if you’re reading this and have experienced the effects of this downswing, let me just say this is a market for professional, experienced people. If you haven’t traded actively for several years in volatile conditions, then you probably don’t have the experience to handle this type of huge price-swings associated with public schizophrenia – seek advice, or stop trading before you lose all your capital. This analysis is the product of 40+ years’ experience in trading such volatile markets and sometimes, even the pro’s get it wrong. The top pro’s always work with mathematical ‘probabilities’ which are themselves taught by their ‘Masters’. Yes, there’s a hierarchy of knowledge how to trade, not unlike good doctors, great doctors and their ‘masters’ too!
Correction Completed! – Uptrend Resumes!
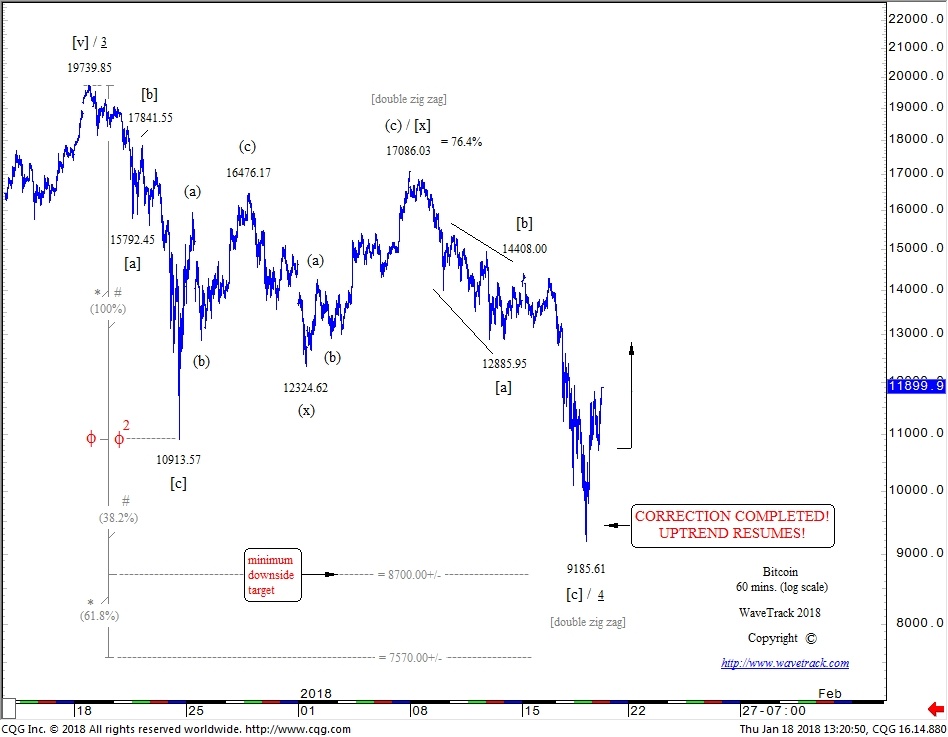
With minimum downside targets being approached yesterday (Wednesday 17th January ’18) with intra-day trading touching 9231.10 (cash bitcoin), 9185.61 (CME), yes, the decline does conform to a completed Elliott Wave double zig zag pattern. This ended minute wave 4 according to our original analysis from the beginning of January. It’s taken less than a month to complete this pattern, a double zig zag, labelled in minuette degree, [a]-[b]-[c]-[x]-[a]-[b]-[c] – see fig #1.
What Next?
The prevailing uptrend can now continue. We can see the obvious sign that this has already begun as prices have unfolded subsequently higher into a five wave impulse pattern up to 11655.00 (cash bitcoin), 11822.79 (CME) in early trading Thursday (18th Jan.’18). This uptrend can either reattempt the December highs, then fall back again so that minute wave 4 continues as a more complex corrective pattern, or it can surge to higher-highs as minute wave 5 of minor wave iii. three. Either way, a platform of support is now behind us at 9231.10 (cash bitcoin), 9185.61 (CME) and this acts as the stop-loss for any trading strategy.
If you’d like more information about next upside targets, get in touch with us by leaving comments via our social media presence ( https://twitter.com/ElliottWave_WTI ) or write to us [email protected]. We’d love to gauge your interest!
Subscribe and get the latest forecasts on Stocks, FX & Commodities – NOW!
Author

Peter Goodburn
WaveTrack International GmbH
WTI HISTORY


