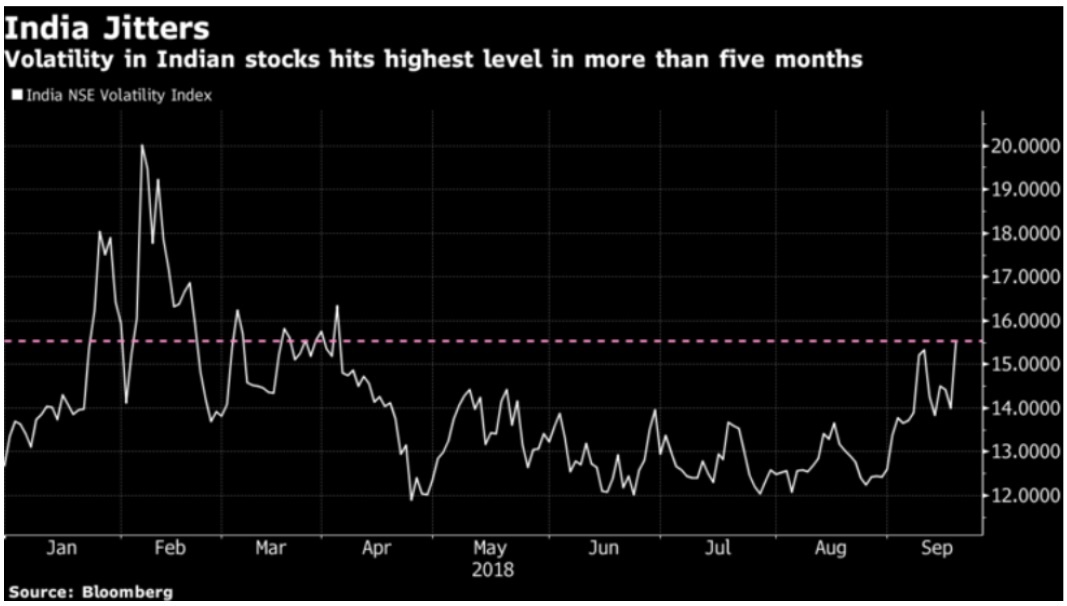
Volatility in India stocks spiked higher last week as panic set in the nation’s financial shares and dragging down Bank Nifty and other benchmark Index. Investors confidence remain fragile after the recent default by IL&FS (Infrastructure Leasing & Financial Services). Then last Friday, India’s central bank rejected the tenure extension of Yes Bank’s Chief Executive Officer. Yes Bank (OTC: YYBKY) plunged 29% on the news and hit the lowest level since 2016, dragging other major India benchmark. Dewan Housing Finance followed along and saw its stocks falling by 43%, the steepest on record. At one point during the day, Dewan fell as much as 60%. The panic was triggered by investor’s speculation that the debt default by IL&FS may spread to other lenders.

Sensex benchmark equity index experienced the most volatile intraday move in more than four years. It swung from 1% gain earlier in the day to a drop of 3% before ending the day down 0.8%.

India Jitters

Some investors are speculating that the RBI (Reserve Bank of India) may tighten rules for housing finance firms after a loose policy led to the increase in bad debts. The central bank has taken a tough stance with the private sector banks lately. It has also refused to extend the tenure of Axis Bank’s CEO before.

How does India’s market look like after the carnage in the financial sectors last week? We will use Elliott Wave to see if there’s any significant technical damage to the Bank Nifty Sector Index. Bank Nifty represents the 12 most liquid and large capitalized stocks from the banking sectors which trade on the National Stock Exchange (NSE).

Bank Nifty Long Term Elliott Wave Outlook

Banknifty

The rally from March 2009 low in Bank Nifty is proposed to be unfolding in a 5 waves impulse where Super Cycle wave (I) ended at 13303.6 and Super Cycle wave (II) ended at 8366.7 as a FLAT. In the proposed count above, Super Cycle wave (III) remains in progress and the subdivision is also in 5 waves impulse. Cycle wave I of (III) ended at 20907.5, Cycle wave II of (III) ended at 13407.25, and Cycle wave III of (III) ended at 28377.9. Cycle wave IV of (III) pullback is expected to complete at 22621.5 – 24816.5, 23.6 – 38.2 fibonacci retracement of Cycle wave III of (III), then the Index can see 1 more push higher to end Cycle wave V (III) before another bigger pullback.

The selloff from Yes Bank, which is constituent of the Bank Nifty therefore hasn’t dramatically changed the outlook of the Bank Nifty, and we still expect dips to be supported in 3-7-11 swing.

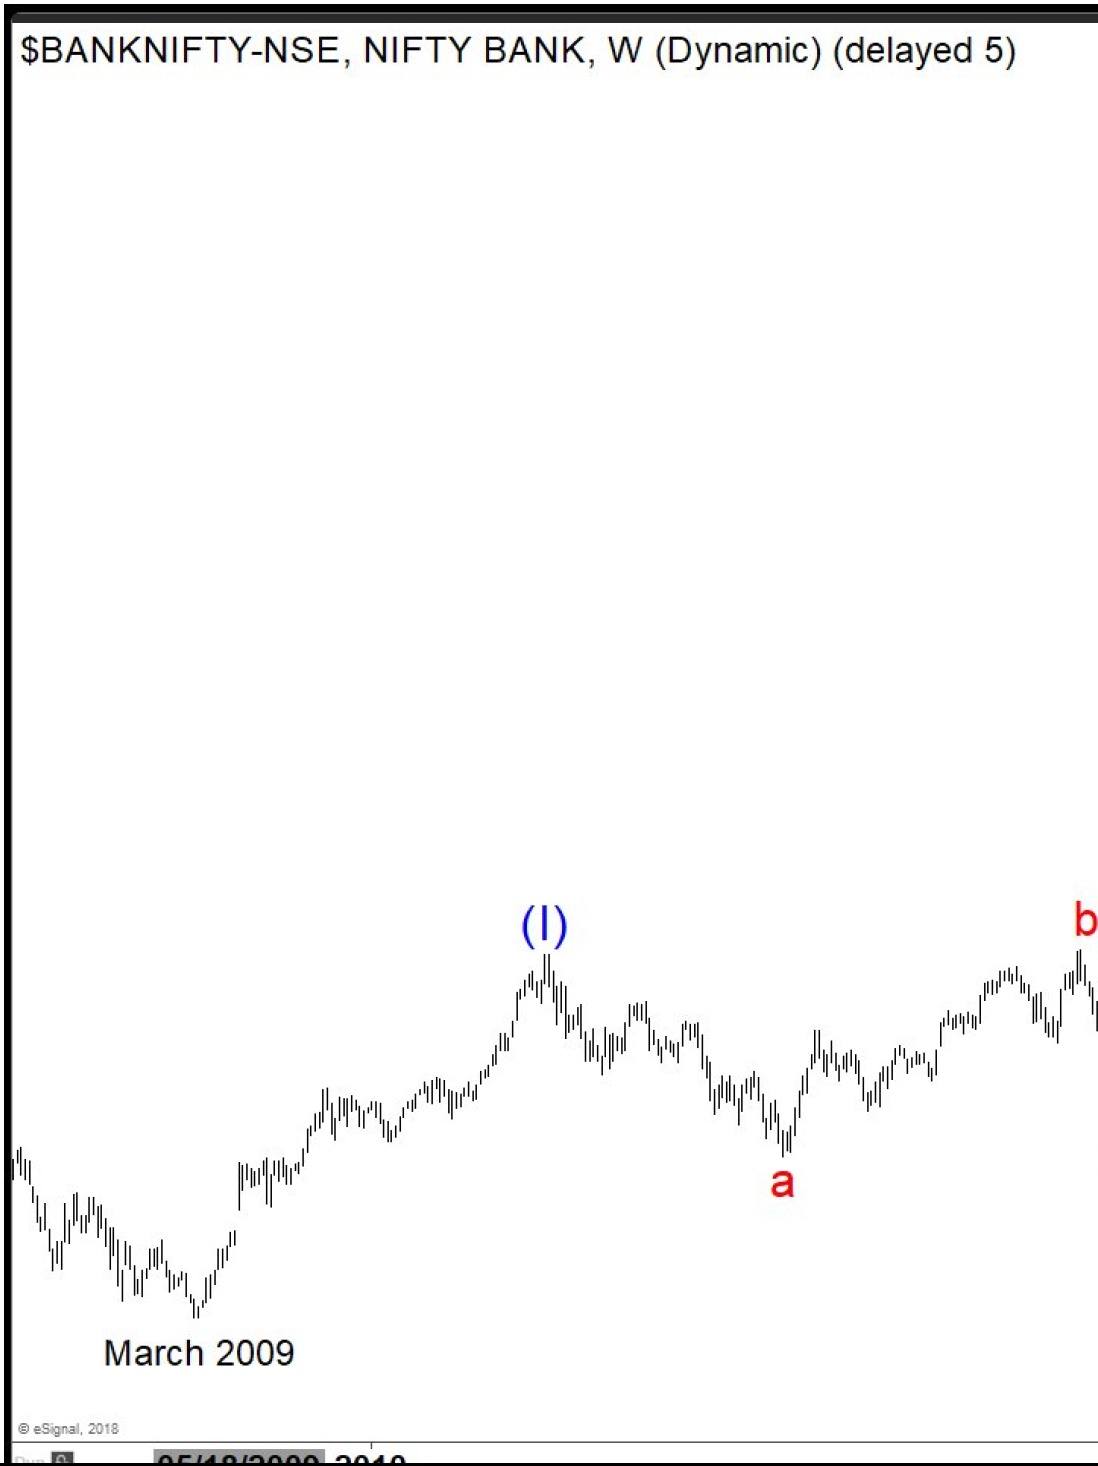
Bank Nifty Alternate #1 Long Term Elliott Wave Outlook

Banknifty

In the alternate view above, Cycle wave IV pullback is unfolding as a zigzag Elliott Wave structure and thus the current decline from Cycle wave III peak at 28377.9 will only end the first leg Primary wave ((A)). Index should then bounce in Primary wave ((B)) before another leg lower in Primary wave ((C)) to end Cycle wave IV. This view is also probable but does not change the overall view that Index should see more upside after correction is over.

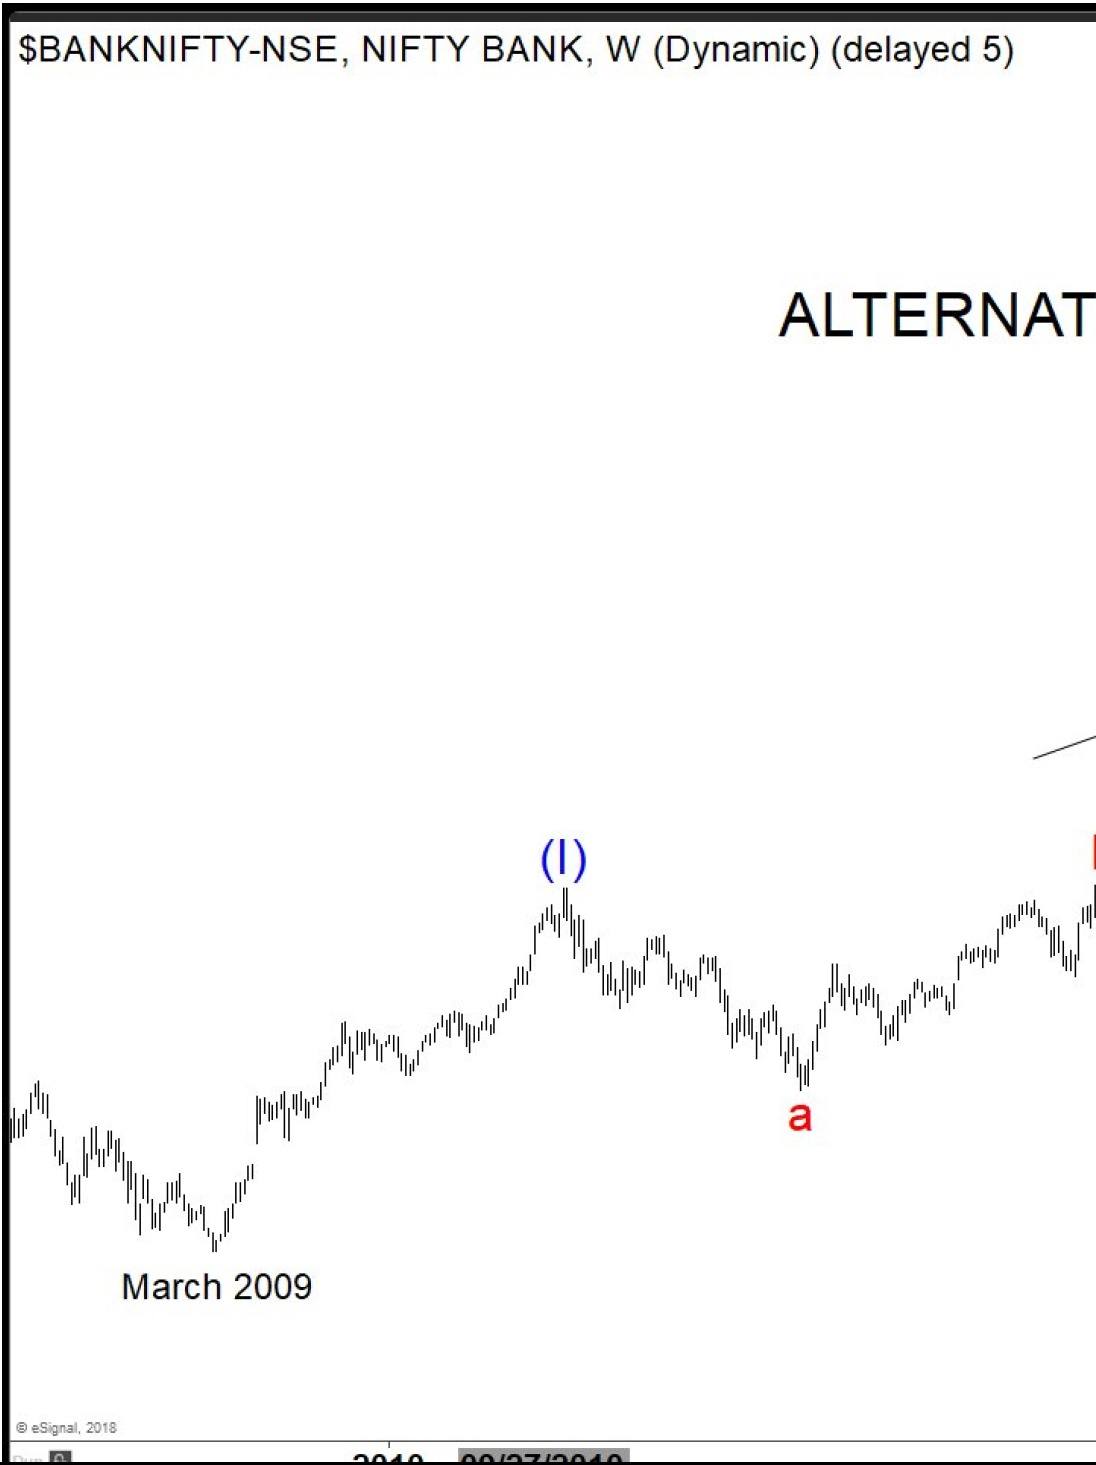
Bank Nifty Alternate #2 Long Term Elliott Wave Outlook

Banknifty

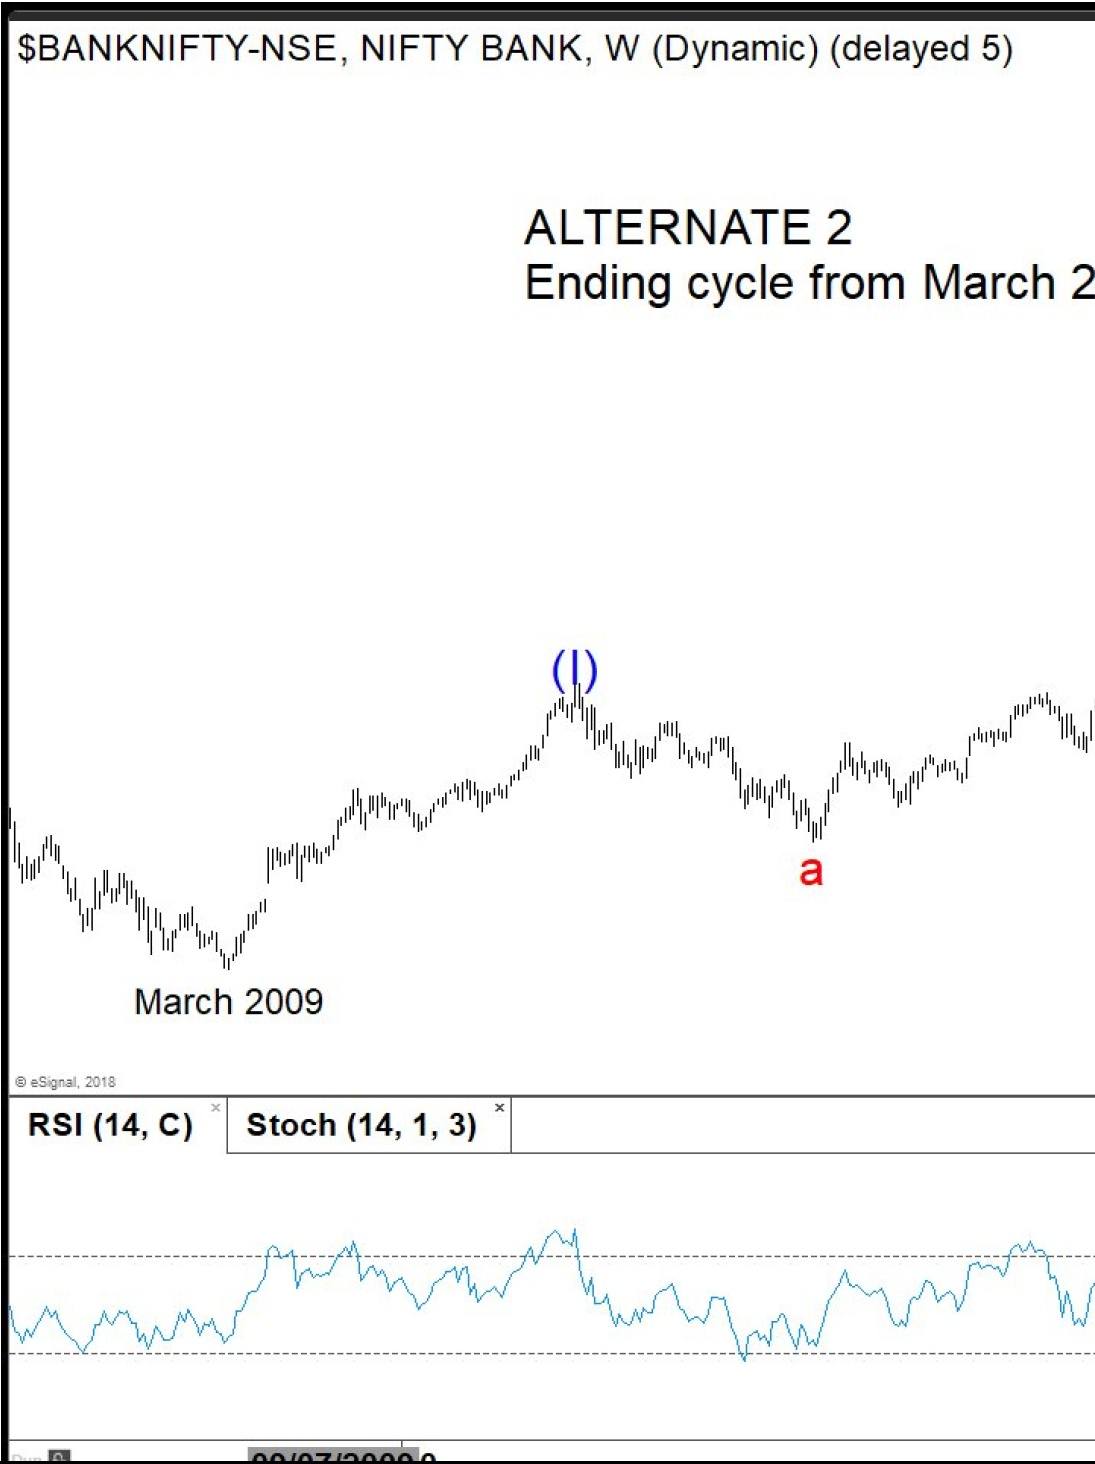
The second alternate view is calling cycle from March 2009 low ended as 5 waves. In this scenario, the Index can see a larger 3 waves pullback to correct the entire rally from March 2009 low before the rally resumes. This is the most bearish view but looking at the Relative Strength Index (RSI), we observe that there is no divergence between proposed Super Cycle wave (III) and (V) in this count. Thus, as wave 5 in impulsive structure usually has a divergence with respect to wave 3, this view therefore is least favored.


Become a Successful Trader and Master Elliott Wave like a Pro. Start your Free 14 Day Trial at - Elliott Wave Forecast.

FURTHER DISCLOSURES AND DISCLAIMER CONCERNING RISK, RESPONSIBILITY AND LIABILITY Trading in the Foreign Exchange market is a challenging opportunity where above average returns are available for educated and experienced investors who are willing to take above average risk. However, before deciding to participate in Foreign Exchange (FX) trading, you should carefully consider your investment objectives, level of xperience and risk appetite. Do not invest or trade capital you cannot afford to lose. EME PROCESSING AND CONSULTING, LLC, THEIR REPRESENTATIVES, AND ANYONE WORKING FOR OR WITHIN WWW.ELLIOTTWAVE- FORECAST.COM is not responsible for any loss from any form of distributed advice, signal, analysis, or content. Again, we fully DISCLOSE to the Subscriber base that the Service as a whole, the individual Parties, Representatives, or owners shall not be liable to any and all Subscribers for any losses or damages as a result of any action taken by the Subscriber from any trade idea or signal posted on the website(s) distributed through any form of social-media, email, the website, and/or any other electronic, written, verbal, or future form of communication . All analysis, trading signals, trading recommendations, all charts, communicated interpretations of the wave counts, and all content from any media form produced by www.Elliottwave-forecast.com and/or the Representatives are solely the opinions and best efforts of the respective author(s). In general Forex instruments are highly leveraged, and traders can lose some or all of their initial margin funds. All content provided by www.Elliottwave-forecast.com is expressed in good faith and is intended to help Subscribers succeed in the marketplace, but it is never guaranteed. There is no “holy grail” to trading or forecasting the market and we are wrong sometimes like everyone else. Please understand and accept the risk involved when making any trading and/or investment decision. UNDERSTAND that all the content we provide is protected through copyright of EME PROCESSING AND CONSULTING, LLC. It is illegal to disseminate in any form of communication any part or all of our proprietary information without specific authorization. UNDERSTAND that you also agree to not allow persons that are not PAID SUBSCRIBERS to view any of the content not released publicly. IF YOU ARE FOUND TO BE IN VIOLATION OF THESE RESTRICTIONS you or your firm (as the Subscriber) will be charged fully with no discount for one year subscription to our Premium Plus Plan at $1,799.88 for EACH person or firm who received any of our content illegally through the respected intermediary’s (Subscriber in violation of terms) channel(s) of communication.

Recommended Content


Recommended Content

Editors’ Picks

EUR/USD holds below 1.0750 ahead of key US data

EUR/USD holds below 1.0750 ahead of key US data

EUR/USD trades in a tight range below 1.0750 in the European session on Friday. The US Dollar struggles to gather strength ahead of key PCE Price Index data, the Fed's preferred gauge of inflation, and helps the pair hold its ground. 

EUR/USD News

GBP/USD consolidates above 1.2500, eyes on US PCE data

GBP/USD consolidates above 1.2500, eyes on US PCE data

GBP/USD fluctuates at around 1.2500 in the European session on Friday following the three-day rebound. The PCE inflation data for March will be watched closely by market participants later in the day.

GBP/USD News

Gold clings to modest daily gains at around $2,350

Gold clings to modest daily gains at around $2,350

Gold stays in positive territory at around $2,350 after closing in positive territory on Thursday. The benchmark 10-year US Treasury bond yield edges lower ahead of US PCE Price Index data, allowing XAU/USD to stretch higher.

Gold News

Bitcoin Weekly Forecast: BTC’s next breakout could propel it to $80,000 Premium

Bitcoin Weekly Forecast: BTC’s next breakout could propel it to $80,000

Bitcoin’s recent price consolidation could be nearing its end as technical indicators and on-chain metrics suggest a potential upward breakout. However, this move would not be straightforward and could punish impatient investors. 

Read more

US core PCE inflation set to signal firm price pressures as markets delay Federal Reserve rate cut bets

US core PCE inflation set to signal firm price pressures as markets delay Federal Reserve rate cut bets

The core PCE Price Index, which excludes volatile food and energy prices, is seen as the more influential measure of inflation in terms of Fed positioning. The index is forecast to rise 0.3% on a monthly basis in March, matching February’s increase. 

Read more

Majors

Cryptocurrencies

Signatures