From panic to reset: Palladium approaches a critical turning point
Few major commodities have displayed the kind of price volatility Palladium has since 2020. After a wild ride, boom and bust included, the price of the metal approaches a key area that will help determine its medium- and long-term outlook. Fasten your seatbelts.
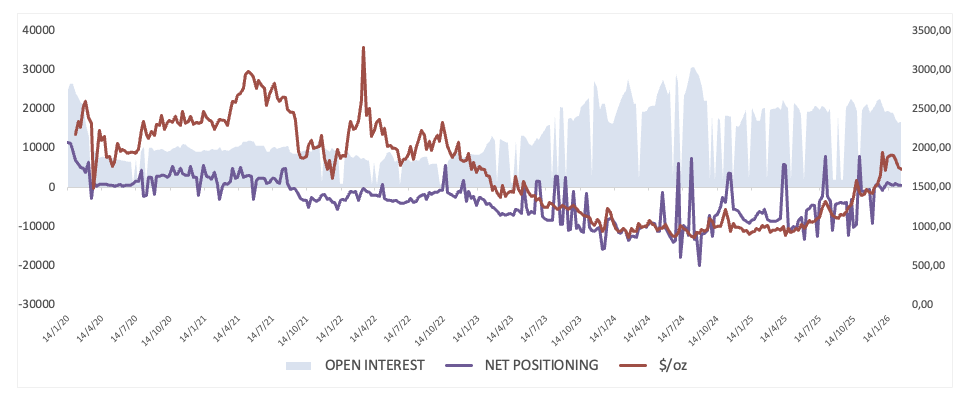
In the space of just a few years, the metal surged above $3,400 during a supply-driven panic, only to collapse back toward $1,000 as industrial fears, substitution dynamics and the electric vehicle transition narrative took hold. The amplitude of that move rivals some of the most dramatic commodity cycles of the past two decades.
This is not a quiet industrial metal. It is a regime-shifter.
From scarcity panic to structural unwind
The 2020-2022 rally was fuelled by a perfect storm: tight supply, heavy reliance on Russian production, strong autocatalyst demand and limited above-ground inventories. When geopolitical tensions intensified, the scarcity premium exploded.
But blow-offs rarely stabilise gently.
Once peak fear subsided and EV adoption accelerated, the narrative flipped. Investors began pricing a future where internal combustion engine demand gradually erodes and platinum substitution gains traction. As that theme gathered momentum, palladium retraced violently.
By late 2023 and into 2024, the market looked washed out.
Capitulation and reset
The decline toward the $1,000-$1,100 zone coincided with extreme pessimism.
Sentiment shifted from “structural shortage” to “structural obsolescence” in less than 24 months. That kind of narrative swing is typically accompanied by positioning liquidation, and price action reflected it.
Technically, the metal moved back toward long-term support levels that had anchored prior cycles. Momentum indicators reset and volatility compressed. The excess was purged.
2025-2026: Reclaim phase underway?
Over the past year, price behaviour has changed meaningfully.
Palladium has reclaimed medium- and long-term moving averages on the weekly and monthly timeframes. Higher lows have begun to form. Momentum has improved without yet reaching euphoric territory.
This rally is not a parabolic breakout, but base construction.
The key zone to watch sits around $1,900-$2,000. A sustained move above that area would mark a structural shift in the longer-term chart and challenge the prevailing “terminal decline” narrative.
Until then, the metal remains in recovery mode, not full revival.
What drives palladium?
Unlike Gold, Palladium is not a monetary hedge. It is tied primarily to industrial demand, particularly autocatalysts used in internal combustion and hybrid vehicles.
That means the macro drivers are different:
- Global auto production trends
- China’s manufacturing cycle
- US consumer resilience
- Platinum substitution dynamics
- Russian supply concentration
- The US Dollar trend
If global manufacturing stabilises and hybrid vehicle demand remains robust, Palladium retains its demand base. If the US Dollar softens and industrial sentiment improves, the cyclical tailwind strengthens.
But the structural headwind from electrification remains.
This dynamic is precisely what sustains volatility.
Technical Outlook: Compression before expansion?
From a chart perspective, Palladium no longer looks like a market in freefall. Instead, it appears to be shifting from liquidation mode into something more constructive.
On the monthly chart, price has managed to climb back above its 55-month moving average and is now pressing up against the 100-month average in the $1,600-$1,700 area. That may sound technical, but in simple terms it means the metal is rebuilding above levels that had previously defined the long slide.
Momentum has also turned. The Relative Strength Index (RSI), which collapsed during the 2023 washout, has recovered steadily and is now moving back toward bullish territory. Taken together, the longer-term picture looks less like structural decay and more like a market trying to form a durable base.
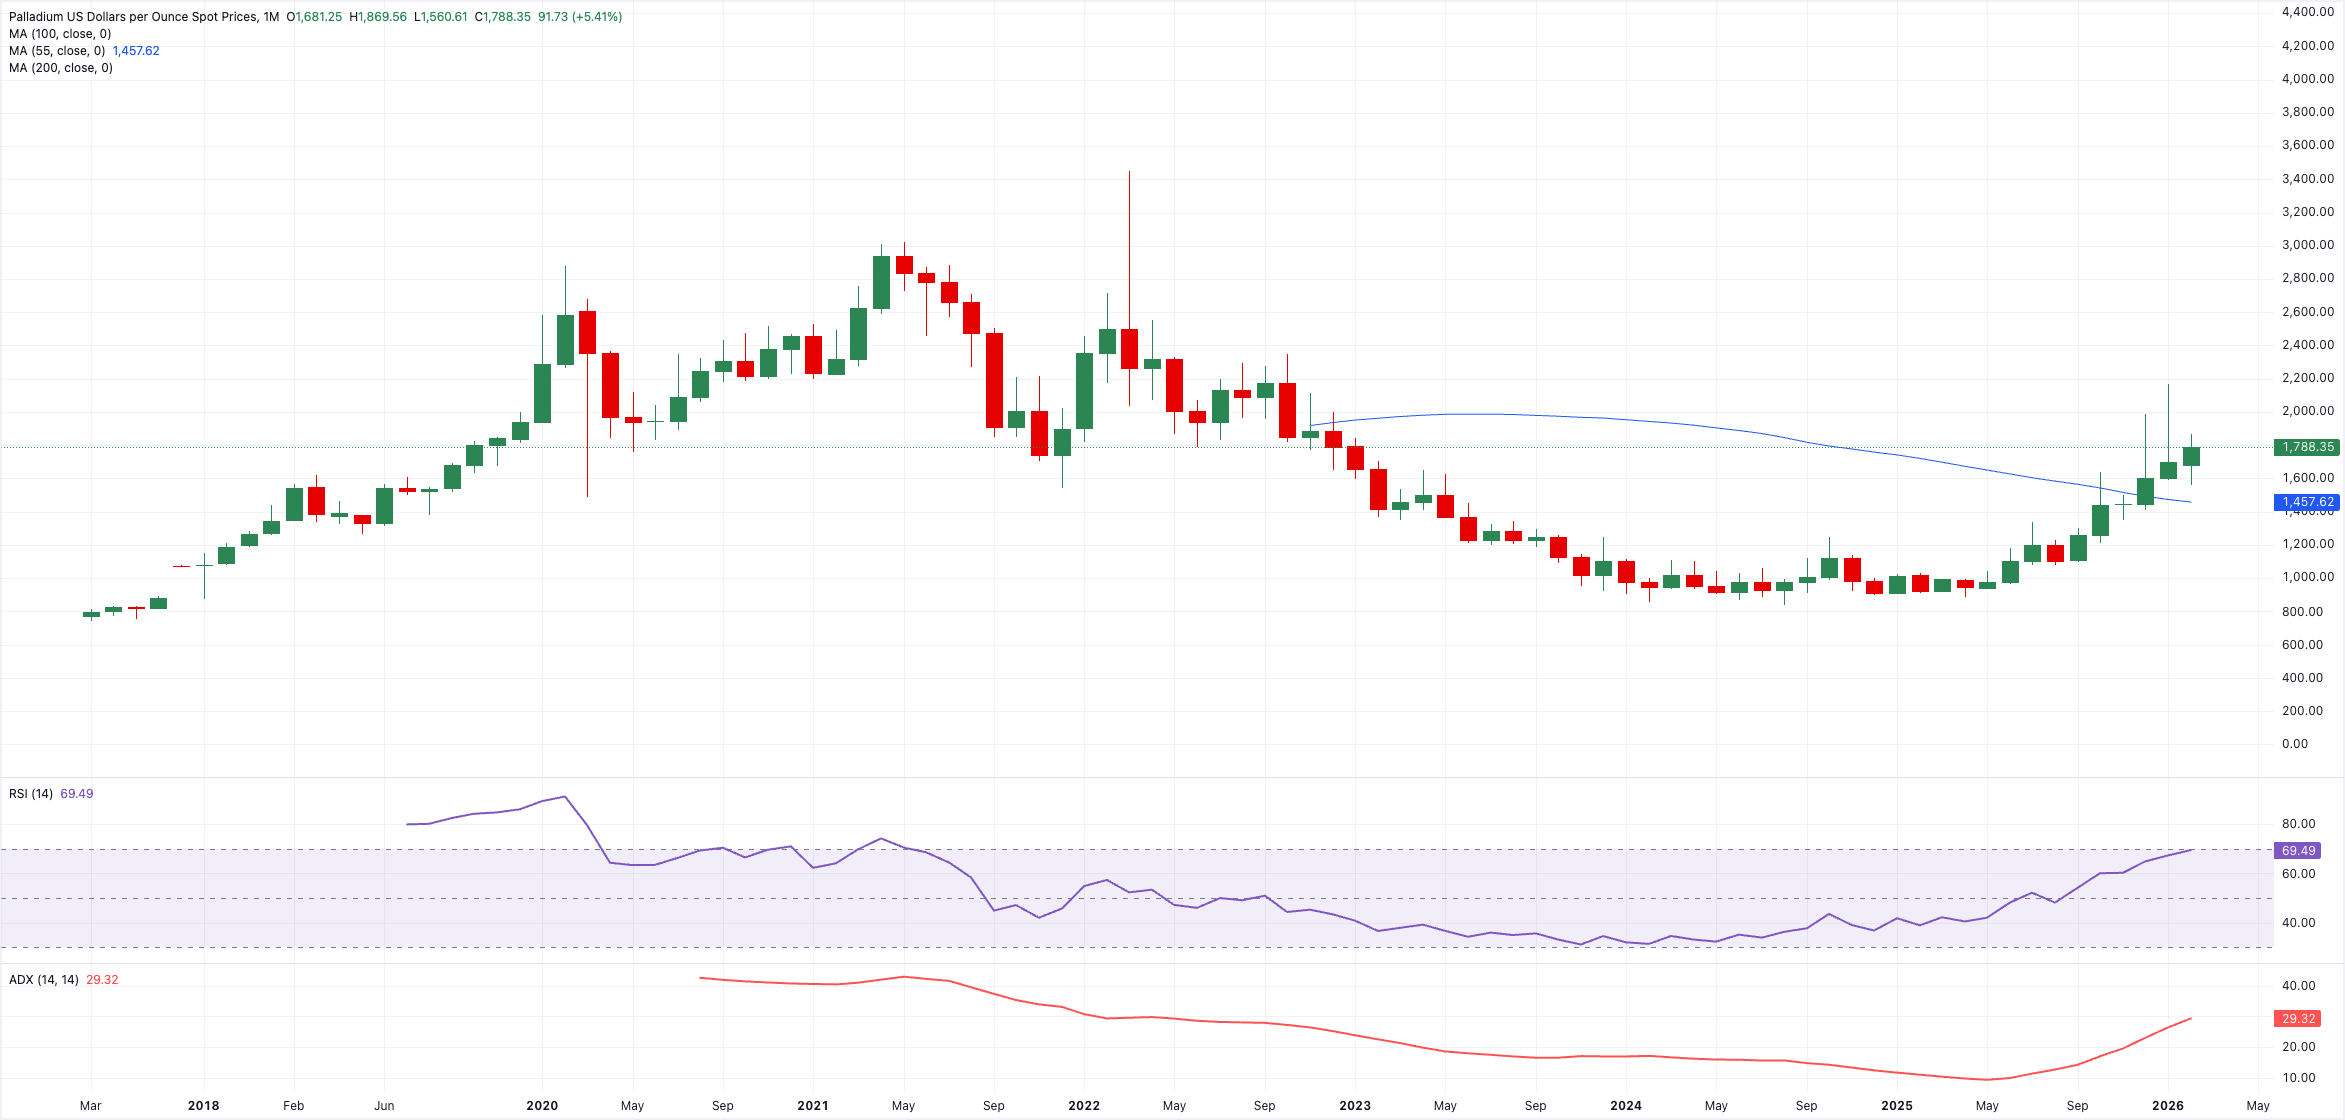
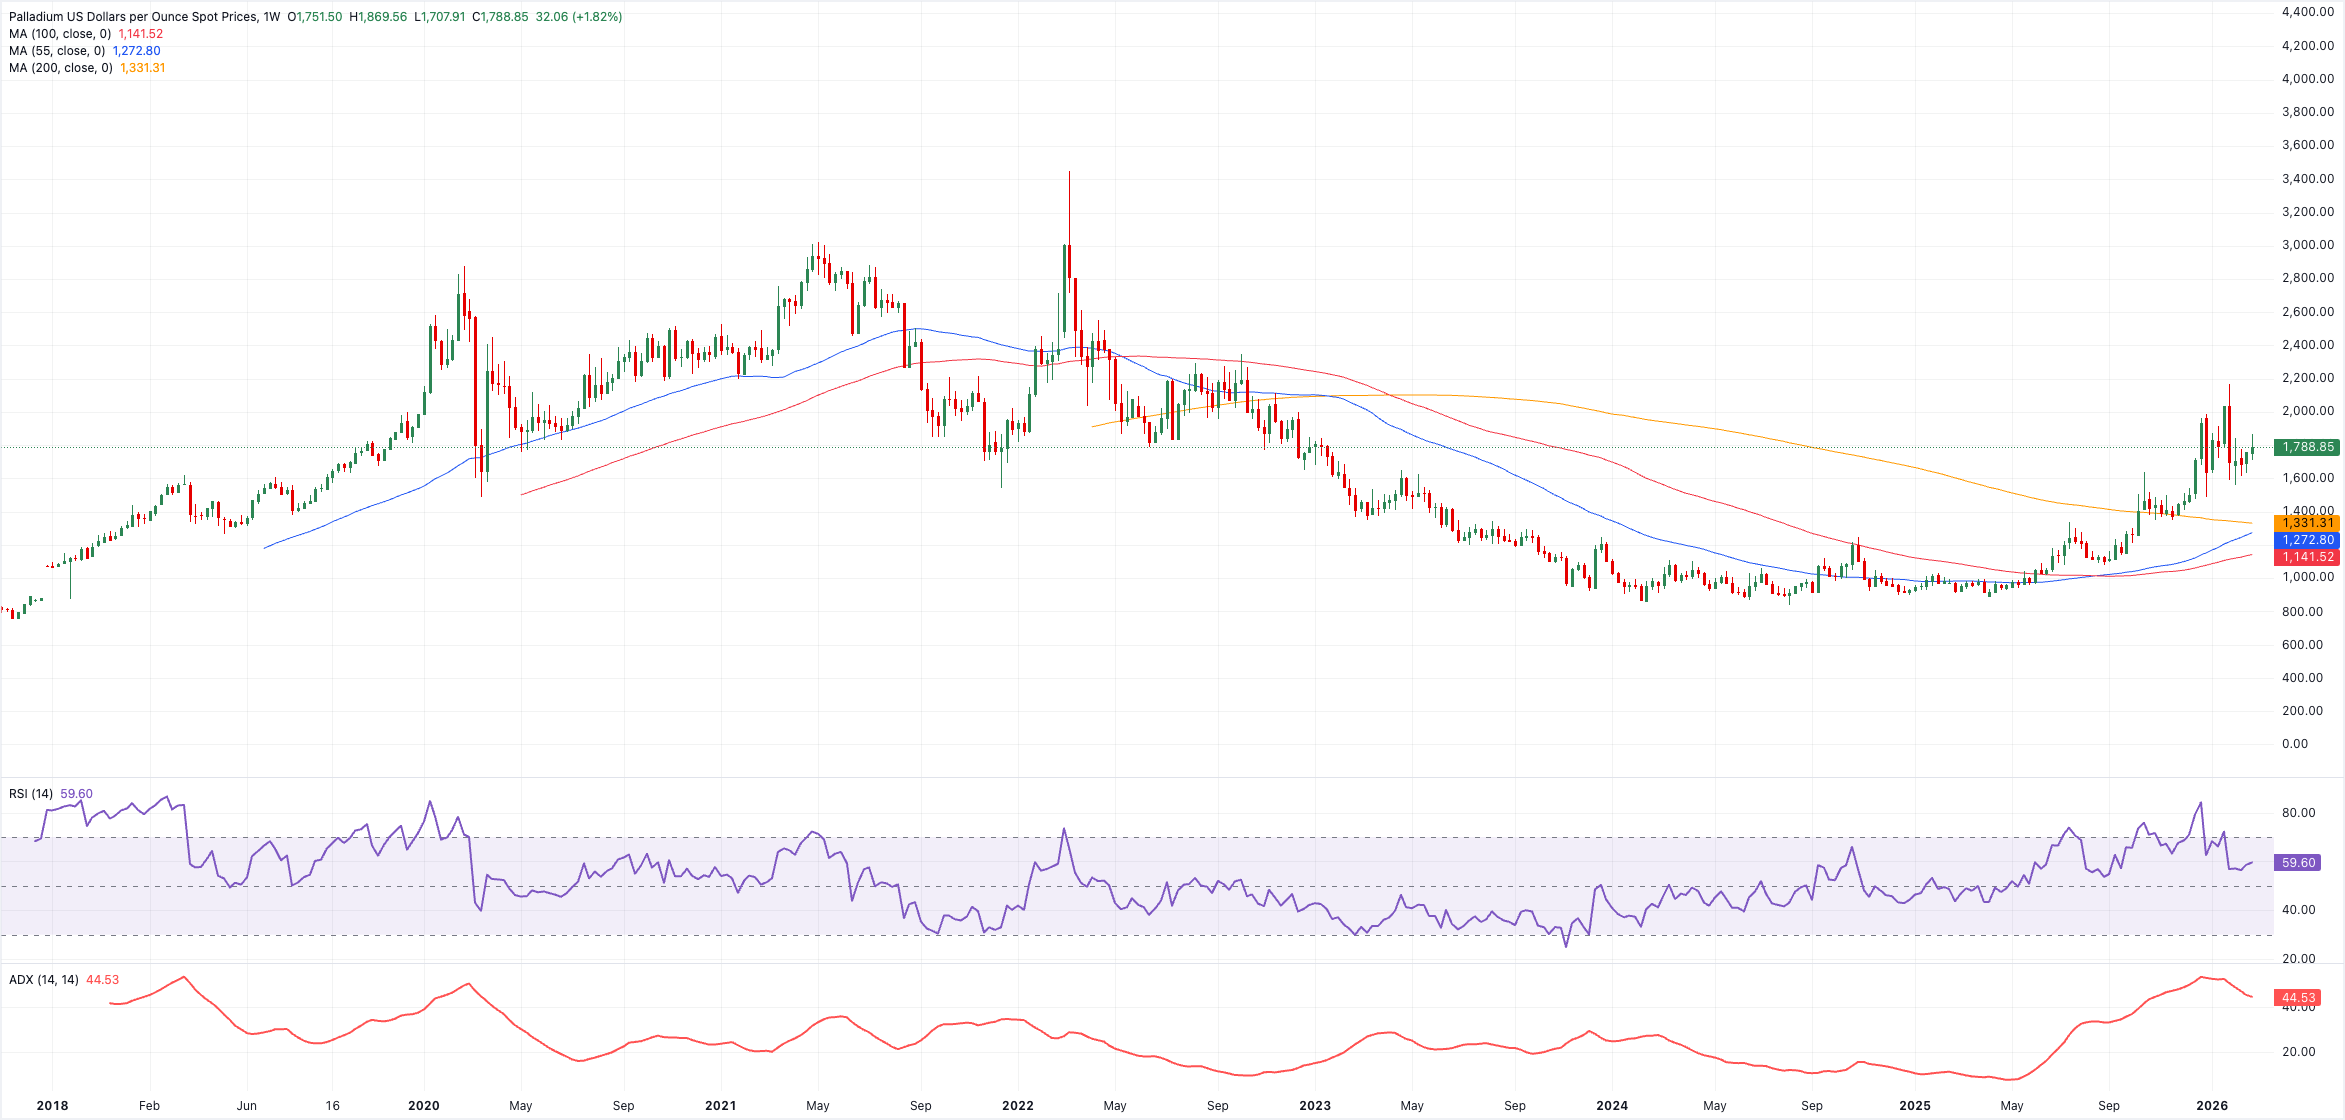
On the weekly chart, higher lows have begun to form since the $1,000 floor held. The trend strength indicators are expanding again, signalling that directional conviction is returning after a prolonged period of compression. Price is now approaching a key resistance band between $1,900 and $2,000, a zone that previously acted as a distribution during the early stages of the collapse.
A sustained weekly break above that area would materially alter the medium-term outlook and likely trigger a reassessment of the “terminal decline” narrative.
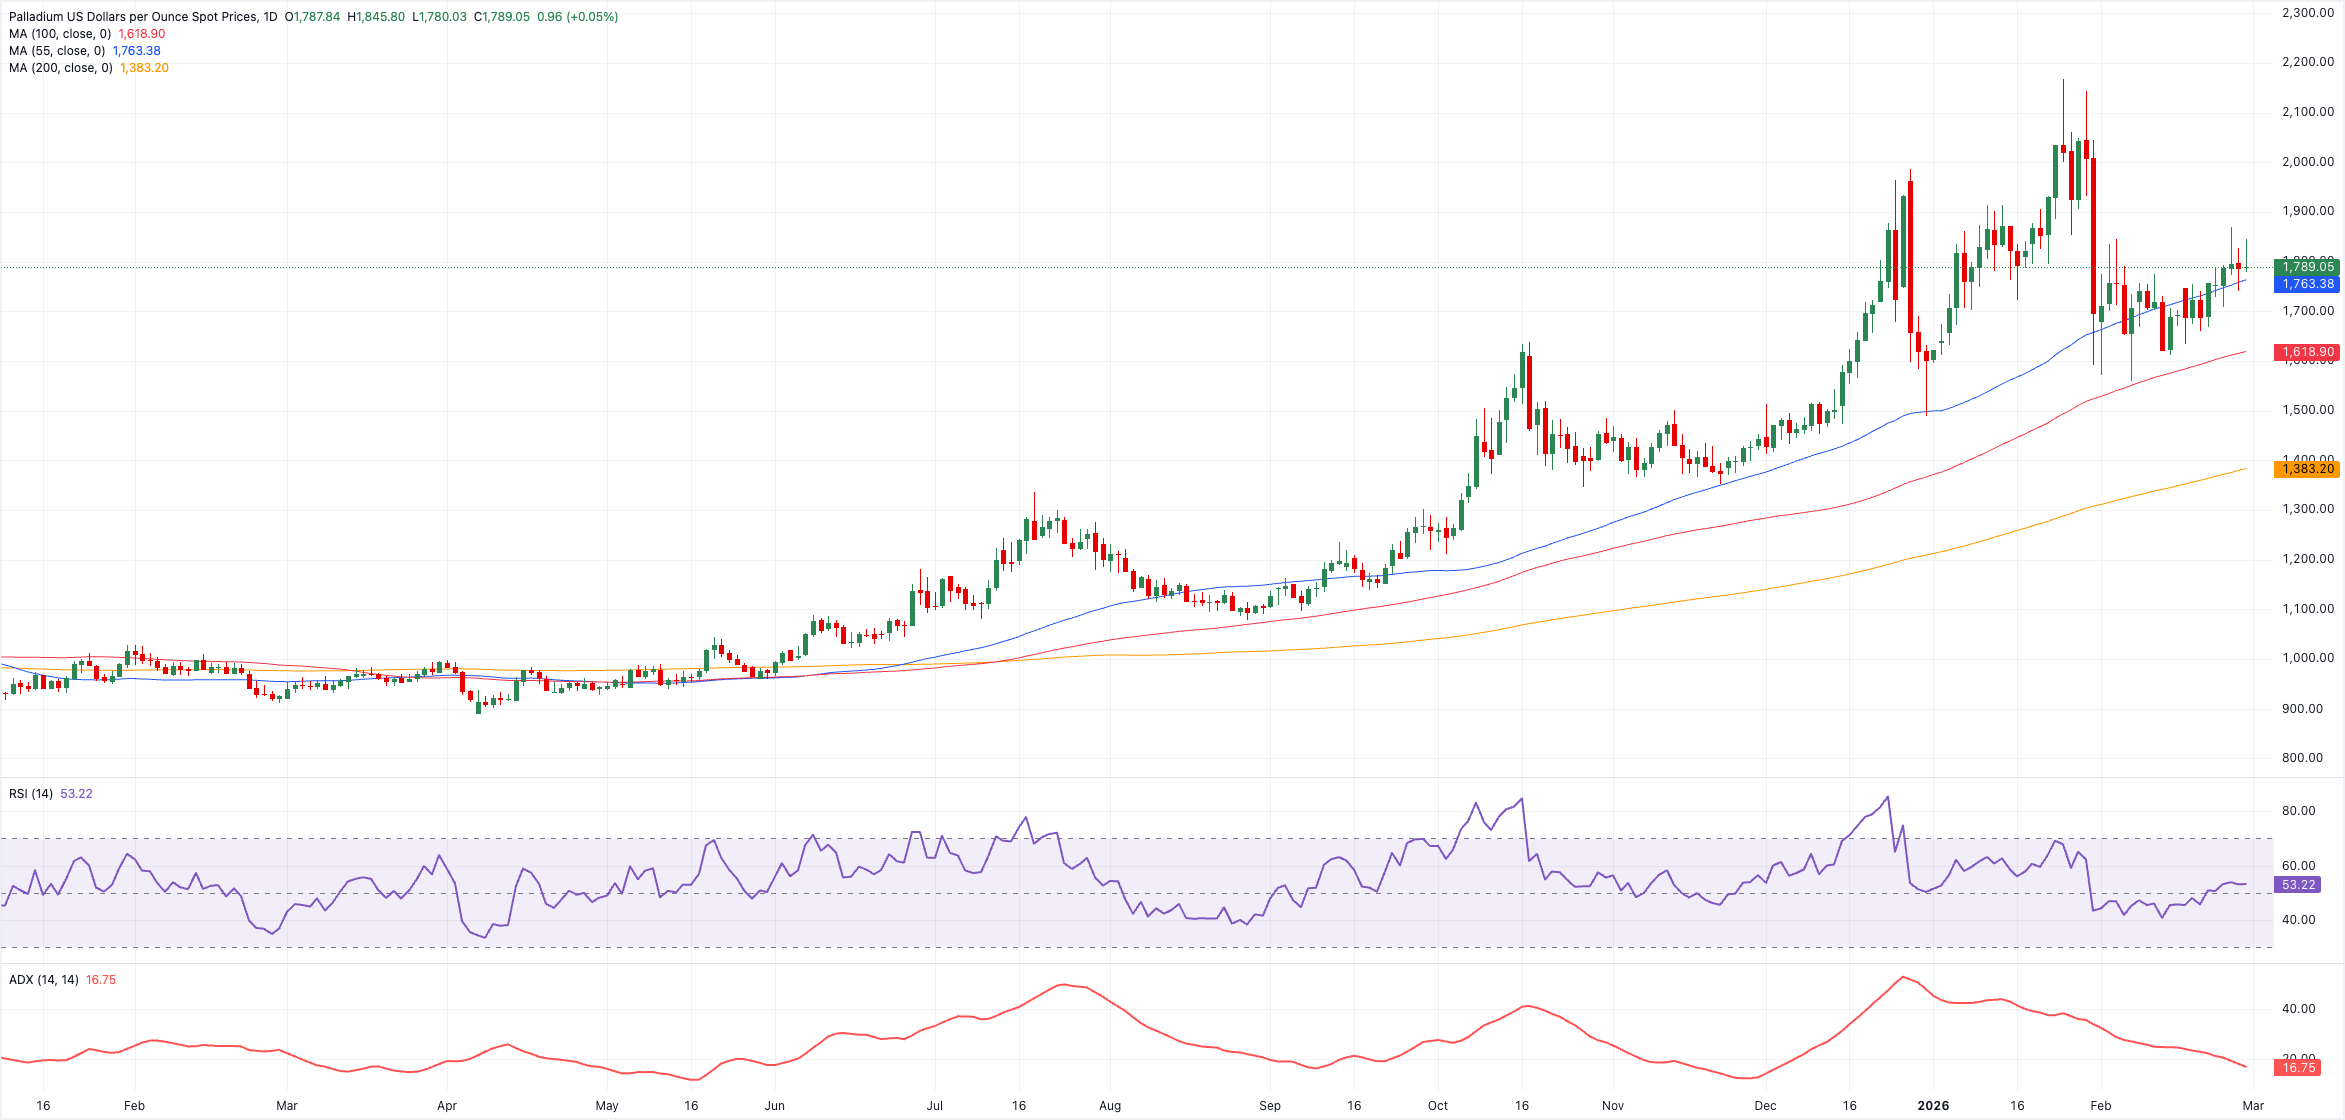
After a big jump, Palladium has settled into a holding pattern around the $1,750-$1,800 area on the daily chart. The move up has stopped in a fairly orderly way instead of getting too hot. Momentum indicators remain in the middle range, indicating that the market is retaining its gains rather than losing momentum.
For now, the $1,700-$1,720 zone acts as a near-term cushion. On the upside, a convincing break above $1,850 would signal that buyers are ready to press the recovery further. Until one of those levels gives way, the metal looks more like it is coiling than collapsing.
In short, the technical picture aligns with the broader macro narrative: the worst of the decline appears to be behind us, but confirmation of a new structural leg higher requires a decisive break above the $1,900-$2,000 region.
Until then, Palladium remains a rebuilding story: volatile, sensitive to macro inputs, and poised at an inflection point rather than in a confirmed breakout.
In a market defined by extremes, Palladium may once again be preparing for a decisive move; the only question is whether conviction ultimately resolves higher or whether volatility reasserts itself before a true structural recovery takes hold.
Bottom line
Palladium’s price action since 2020 tells a story of excess, liquidation and reconstruction.
The metal has moved from scarcity panic to near-obsolescence pricing in just a few years. Now it sits at a potential inflection point, no longer collapsing, not yet breaking out.
The next sustained move will likely be driven not by hype, but by clarity: clarity on industrial demand, clarity on substitution, and clarity on the global growth cycle.
For now, Palladium remains one of the most volatile and narrative-sensitive metals in the commodity complex.
And that alone makes it worth watching.
Author

Pablo Piovano
FXStreet
Born and bred in Argentina, Pablo has been carrying on with his passion for FX markets and trading since his first college years.