AUD/USD Forecast: Further declines expected on a break below 0.6685

AUD/USD Current Price: 0.6703
- The Reserve Bank of Australia will announce its monetary policy early on Tuesday.
- The poor performance of Wall Street undermined demand for the Aussie.
- AUD/USD turned bearish in the near term and can extend its slide towards 0.6600.
The AUD/USD pair ends Monday a handful of pips above a daily low of 0.6703, retreating sharply after surging to 0.6850 during Asian trading hours. The pair rallied on the back of the broad US Dollar weakness as a better market mood weighed on the safe-haven currency. However, the American currency recovered drastically following the release of upbeat US data, which weighed on stock markets and hence, the Aussie.
Australian data was mixed. The country published at the beginning of the day the November AIG Performance of Construction Index, which improved from 43.3 in October to 48.2. Also, S&P Global upwardly revise the November Services PMI to 47.6 from a preliminary estimate of 47.2. Both indexes remain in contraction territory, but improving figures are an early sign of a potential bottom in the economic setback. On a negative note, TD Securities Inflation rose to 5.9% YoY from 5.2% in October, while Q3 Company Gross Operating Profits plummeted 12.4% against an expected increase of 10.1%.
On Tuesday, the focus will be on the Reserve Bank of Australia. The central bank is expected to hike the benchmark rate by 25 bps from the current 2.85% to 3.1%. However, there is a chance Governor Philip Lowe & co would choose to hold the fire for now. The main focus, however, will be on what Australian policymakers have under their sleeves for the upcoming meetings.
AUDUSD short-term technical outlook
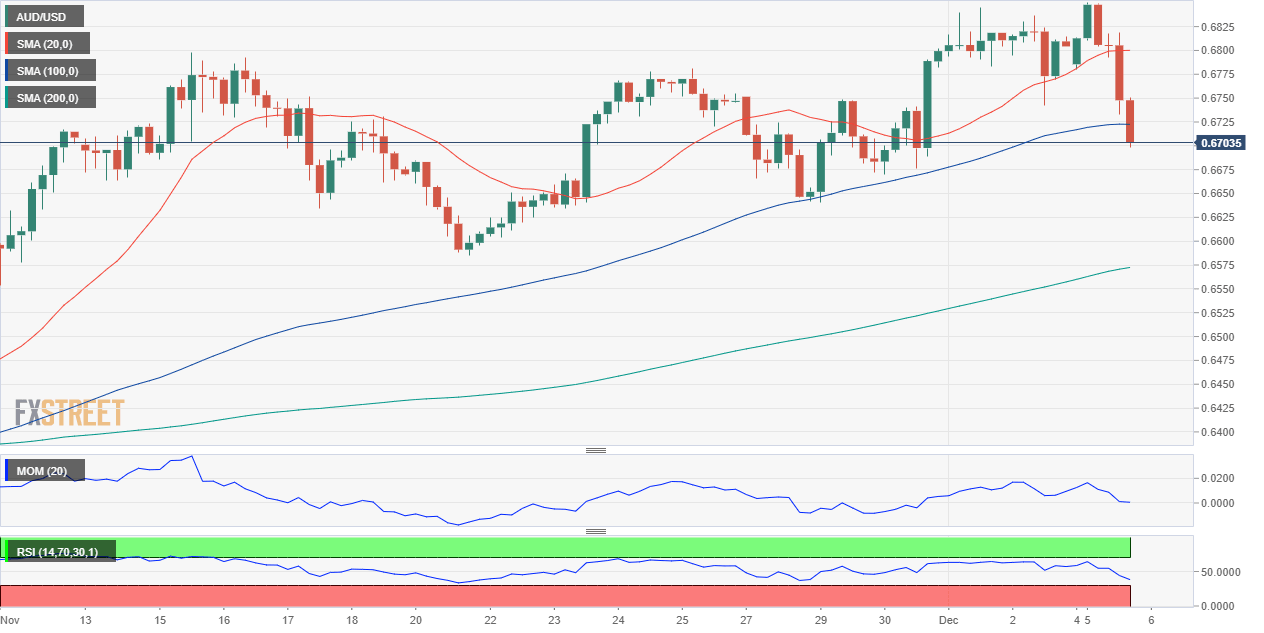
The daily chart for AUD/USD pair shows that it is developing above converging 20 and 100 SMAs at 0.6685, with the shorter one maintaining its bullish slope. On the other hand, technical indicators turned south, with the Momentum crossing its midline into negative territory and the RSI currently at 54, supporting a bearish extension, particularly if the mentioned support gives up.
In the near term, and according to the 4-hour chart, the risk skews to the downside. The pair is trading below its 20 and 100 SMAs, both partially losing their bullish strength, while the 200 SMA maintains its firmly bullish slope far below the current level. Technical indicators, in the meantime, consolidate at fresh one-week lows within negative levels, also supporting another leg south.
Support levels: 0.6685 0.6650 0.6610
Resistance levels: 0.6730 0.6770 0.6815
Premium
You have reached your limit of 3 free articles for this month.
Start your subscription and get access to all our original articles.
Author

Valeria Bednarik
FXStreet
Valeria Bednarik was born and lives in Buenos Aires, Argentina. Her passion for math and numbers pushed her into studying economics in her younger years.


