AUD/USD Forecast: Aussie at risk despite mildly optimistic RBA

AUD/USD Current Price: 0.6293
- The Reserve Bank of Australia is still concerned about too high inflation.
- US Dollar demand was subdued amid higher equities and stable yields.
- AUD/USD fails to extend gains beyond a Fibonacci resistance at 0.6345.
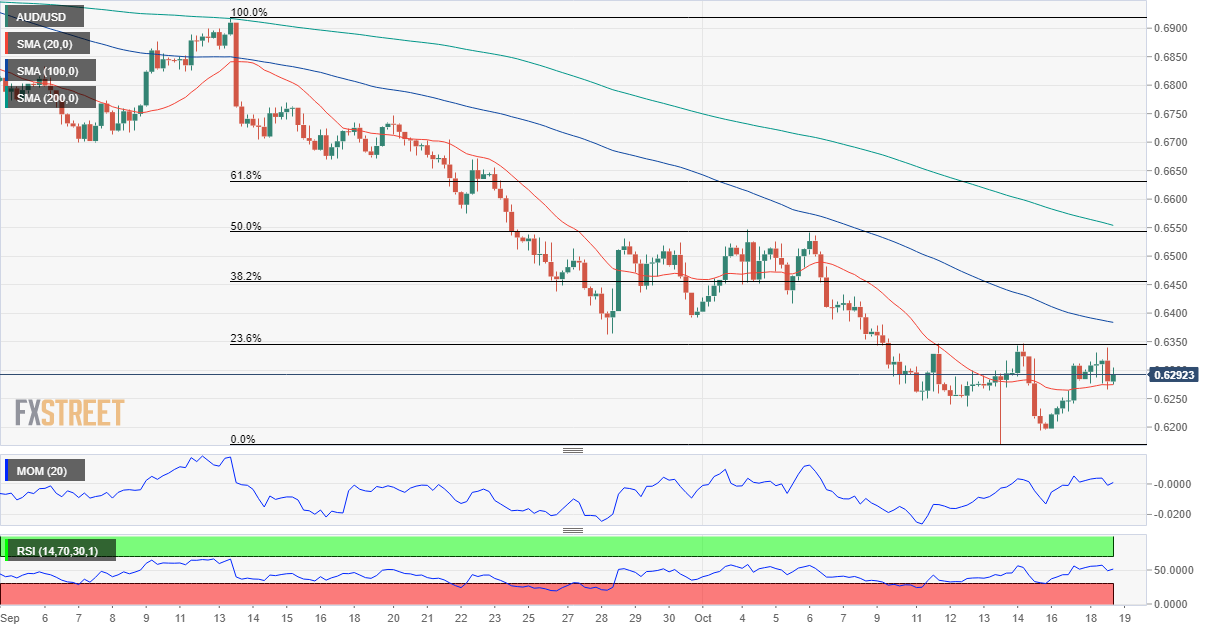
The AUD/USD pair peaked at 0.6339 on Tuesday but trimmed most of its intraday gains and settled at sub-0.6300. The pair swung alongside global equities, advancing throughout the first half of the day, later easing as Wall Street lost steam ahead of the close. Nevertheless, US indexes hold on to gains at the end of the day, keeping demand for the American Dollar subdued.
The Australian dollar benefited from encouraging local headlines as the Reserve Bank of Australia published the Minutes of the October monetary policy meeting. The document showed that policymakers assessed a 50 bps rate hike but finally opted for a 25 bps as much of the 250 bps hiked since May had yet to feed through into mortgage payments. Aditionally, they remarked that, given that inflation is still too high, further interest rate increases would likely be needed. O Wednesday, Australia will publish the September Westpac Leading Index, previously at -0.05%.
AUD/USD short-term technical outlook
The AUD/USD pair met sellers ahead of a Fibonacci resistance level at 0.6345, the 23.6% retracement of the September/October slide. The daily chart shows that the risk remains skewed to the downside, as the 20 SMA keeps heading south well above the current level, accelerating its decline below the longer ones. t the same time, the Momentum indicator turned lower within negative levels, while the RSI indicator consolidates at around 35.
For the near term, the outlook is neutral-to-bearish. The 4-hour chart shows that the pair rests above a flat 20 SMA while the longer ones maintain their bearish slopes above the current level. Technical indicators are stuck around their midlines, the Momentum heading marginally lower and the RSI consolidating around 50. B ars will have better chances if the pair clearly breaks through 0.6270, a static support level.
Support levels 0.6270 0.6230 0.6190
Resistance levels: 0.6345 0.6380 0.6420
Author

Valeria Bednarik
FXStreet
Valeria Bednarik was born and lives in Buenos Aires, Argentina. Her passion for math and numbers pushed her into studying economics in her younger years.