|

AUD/USD analysis: US-China tensions undermine Aussie

AUD/USD Current price: 0.7104

  • Escalating trade war sent AUD/USD to its lowest since February 2016.
  • Chinese trade balance released over the weekend could weigh on the weekly opening.

The AUD/USD pair collapsed Friday to close the week at 0.7104, its lowest since February 2016, as the Aussie is sensitive to China-negative headlines, given that the second world's largest economy is the major trade partner of the mining-based economy. Dollar's broad strength and falling equities, added to Aussie's slump after US President Trump told reporters that his administration is ready to impose new tariffs on $267 billion worth of Chinese goods in addition to the planned $200 billion.  News released during the weekend did little for the AUD, as Chinese trade balance showed that the surplus of the country with the US hit a record high of $31.05B in August, up from $28.09B n July. The total trade balance in dollar terms posted a below-expected surplus of $27.9B.  Exports grew 9.8% vs. the expected 10.1%, while imports in the same period surpassed market's estimates, printing 20%.  This Monday, attention will remain on China, as the country will unveil August inflation data. RBA Assistant Governor Bullock is set to speak at an Australian Industry Group event, about "The Evolution of Household Sector Risks."

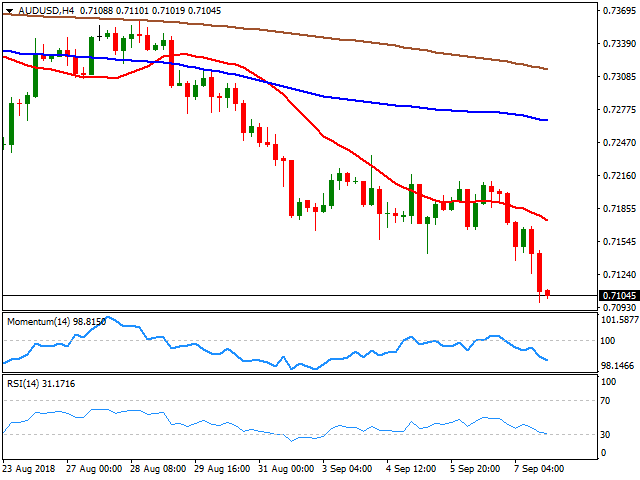
Despite extremely oversold, there are no technical signs that the pair has found a bottom. The bearish momentum remains firmly in place, with speculative interest now eyeing January 2016 low, at 0.6826 as the next big bearish target. In the meantime, technical readings in the daily chart support a downward extension for this Monday, as indicators approach oversold readings with almost vertical slopes, as the price continues declining away from sharply bearish moving averages. In the shorter term, and according to the 4 hours chart, the risk is also skewed to the downside, as the pair finished well below its 20 SMA after struggling mid-week to surpass it, while technical indicators maintain their sharp downward slopes well into negative territory.

Support levels: 0.7095 0.7065 0.7030

Resistance levels:  0.7140 0.7180 0.7210

View Live Chart for the AUD/USD

Author

Valeria Bednarik

Valeria Bednarik was born and lives in Buenos Aires, Argentina. Her passion for math and numbers pushed her into studying economics in her younger years.

More from Valeria Bednarik
Share:

Editor's Picks

EUR/USD gathers strength to near 1.1550 ahead of ECB rate decision

The EUR/USD pair trades in positive territory near 1.1540 during the early Asian trading hours on Thursday. Rising bets that the European Central Bank will deliver a rate hike at its June policy meeting later on Thursday underpin the Euro against the Greenback. 


GBP/USD nudges higher above 1.3350 despite rising Fed hike bets

The GBP/USD pair gathers strength to around 1.3385 during the Asian trading hours on Thursday. However, the potential upside might be limited amid rising expectations for higher-for-longer US interest rates. Markets might turn cautious later in the day ahead of the US Producer Price Index report.

Gold holds below $4,100 after rebounding from seven-month lows

Gold clings to moderate gains in Asia on Thursday, following its rebound from the lowest level since November 2025 at $4,024. Renewed US-Iran hostilities push Crude Oil prices higher, reviving inflationary concerns and bolstering hawkish Fed bets. This continues to drive flows away from the non-yielding bullion, though subdued US Dollar demand helps spot prices to find some support.

Bitcoin faces further downside risk amid growing short-term holder losses, weak ETF demand

Bitcoin's recent decline toward the $60,000 level has pushed the market further into bearish territory, with new investors suffering huge unrealized losses, according to a Glassnode report on Wednesday. The firm noted that Bitcoin's earlier May rally now appears increasingly as a "bear bounce".

From sizzle to fizzle: Tech sinks as Oil puts the Fed tail back on the table
Wall Street was not hit by one punch. It was caught between three swinging doors at the same time: a renewed technology unwind, a fresh geopolitical oil bid, and a wave of equity supply that is starting to look less like capital formation and more like a liquidity test for the entire AI complex.
The US economy defies the rules: 100 days into the Oil shock and the recession signal is still missing

More than three months after the start of the Iran war and the resulting disruption to global energy markets, the US economy continues to display remarkable resilience. The conflict has triggered a sharp rise in Oil prices, reignited inflationary pressures and fueled widespread concerns about a potential economic slowdown.