AUD/JPY Elliott Wave technical analysis [Video]
![AUD/JPY Elliott Wave technical analysis [Video]](https://editorial.fxsstatic.com/images/i/AUD-bullish-chart_XtraLarge.png)
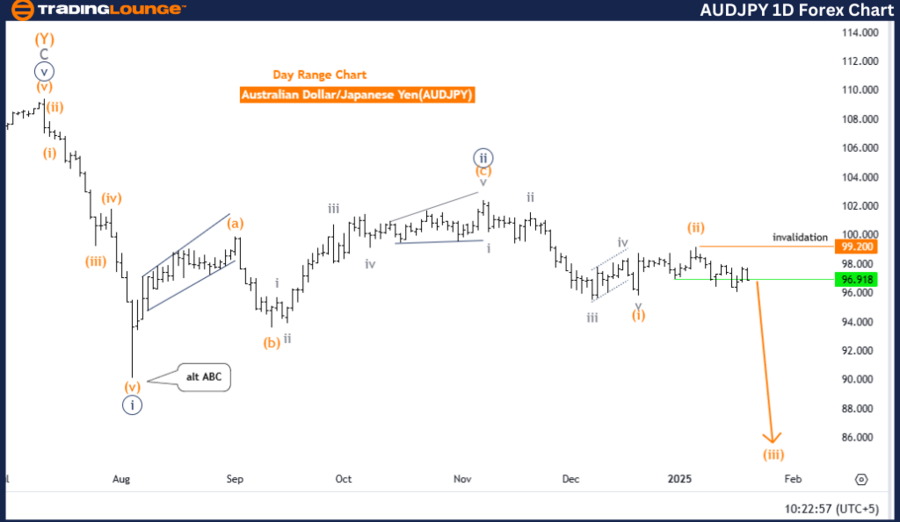
Australian Dollar /Japanese Yen (AUD/JPY) day chart
AUD/JPY Elliott Wave technical analysis
-
Function: Bearish Trend.
-
Mode: Impulsive.
-
Structure: Orange Wave 3.
-
Position: Navy Blue Wave 3.
-
Direction next lower degrees: Orange Wave 3 (Started).
-
Details: Orange wave 2 appears completed, and orange wave 3 is now in progress.
-
Wave cancel invalid level: 99.200.
Analysis overview
The daily AUDJPY chart presents a bearish trend following Elliott Wave principles. The ongoing trend is classified as impulsive, with the wave structure currently identified as orange wave 3, signaling an ongoing downward momentum. This projection suggests further potential price declines.
Within the broader wave sequence, the position is specified as navy blue wave 3, which emphasizes the continuation of bearish market sentiment. This stage represents an essential phase in the ongoing downward trend, where orange wave 3 is currently driving price action.
The prior completion of orange wave 2 marks a transition into the next phase, orange wave 3. This movement plays a significant role within the Elliott Wave framework, further establishing the bearish trend. Lower degree wave directions also indicate alignment with the ongoing development of orange wave 3, strengthening the outlook for continued downside movement.
Key invalidation level
A critical invalidation level is set at 99.200. Any price movement above this threshold would invalidate the current wave count and necessitate a reassessment of the analysis. As long as the price remains below this level, the bearish wave sequence holds and provides a structured framework for future market predictions.
Conclusion
In summary, the AUDJPY daily chart analysis reflects a persistent bearish trend, with the focus on the development of orange wave 3 within the larger navy blue wave 3 structure. The completion of orange wave 2 has set the stage for ongoing downward momentum. As long as the price stays below 99.200, the bearish outlook remains valid, with further declines expected as orange wave 3 continues its progression.
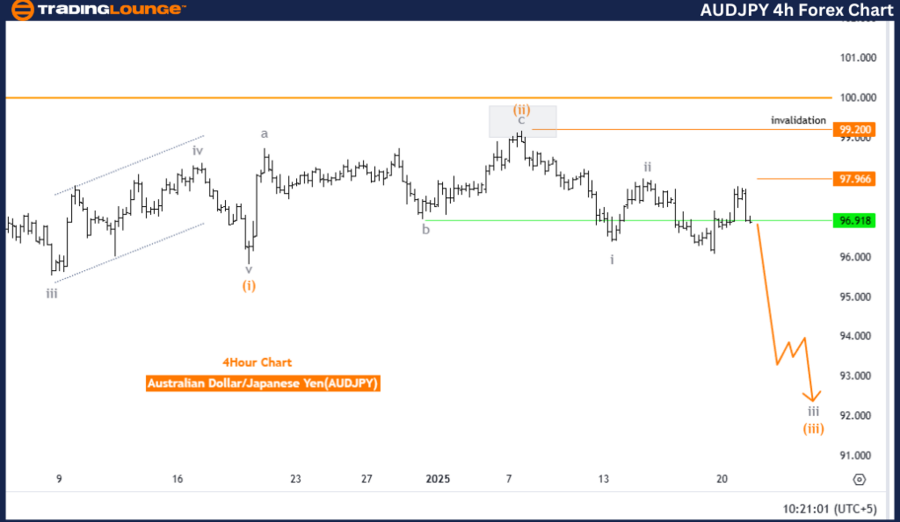
AUD/JPY four-hour chart
AUD/JPY Elliott Wave technical analysis
-
Function: Bearish Trend.
-
Mode: Impulsive.
-
Structure: Gray Wave 3.
-
Position: Orange Wave 3.
-
Direction Next Lower Degrees: Gray Wave 3 (Started).
-
Details: Gray wave 2 appears completed, and gray wave 3 is now in progress.
-
Wave cancel invalid level: 99.200.
Analysis overview
The AUDJPY 4-hour chart analysis reflects a prevailing bearish trend, based on Elliott Wave principles. The ongoing trend is categorized as impulsive, with the current wave structure identified as gray wave 3, indicating sustained downward momentum. This pattern suggests further potential declines in the market.
The current wave position is within orange wave 3, representing a crucial phase in the development of gray wave 3. This signifies that the market is actively progressing within the larger impulsive framework, maintaining the overall bearish outlook. The completion of gray wave 2 confirms the transition into gray wave 3.
The direction at the next lower degrees remains aligned with the ongoing bearish trend of gray wave 3, reinforcing expectations for continued downside movement as the wave structure further develops.
Key invalidation level
A crucial invalidation level is defined at 99.200. If the price moves above this level, the current wave count will be invalidated, necessitating a review of the market analysis. However, as long as the price stays below this threshold, the bearish wave structure remains intact and valid.
Conclusion
In summary, the AUDJPY 4-hour chart supports a continuing bearish trend, driven by the development of gray wave 3, following the completion of gray wave 2. The positioning within orange wave 3 confirms the downward trajectory. The invalidation level at 99.200 serves as a key reference point for maintaining the current analysis. As gray wave 3 progresses, further declines are expected, reinforcing the broader bearish sentiment.
AUD/JPY Elliott Wave technical analysis [Video]
Author

Peter Mathers
TradingLounge
Peter Mathers started actively trading in 1982. He began his career at Hoei and Shoin, a Japanese futures trading company.


