Executive Summary

Businesses have increased debt loads over the course of the current economic cycle, generating some concern from Fed officials and market watchers. In a previous report, we examined the health of non-financial corporate (NFC) businesses by developing an index of eight financial measures. We determined that the financial health of the corporate sector was not worrisome at present, despite having deteriorated somewhat in recent years. But what about the financial health of the non-corporate sector, i.e., small businesses?

Using the methodology in our last report, we create an index to gauge the financial health of the non-financial non-corporate (NFNC) business sector. Debt in the NFNC sector has trended higher over the expansion, but, unlike the corporate sector, remains within its historic range when measured against GDP. By most metrics, the finances of NFNC businesses appear to be in decent shape. The majority of debt is long term, asset values have been rising faster than debt, and interest coverage remains historically high. Yet, our overall index of NFNC health shows the financial position of smaller businesses is weakening on net, as debt continues to increase, interest rates rise and profit growth slows.


More to the Business Sector than Just Corporations

In a recent report, we developed an index to gauge the financial health of the non-financial corporate sector.1 The methodology we employed allowed us to succinctly aggregate eight metrics of corporate financial health into a single index. In short, we concluded that the financial health of the NFC sector has deteriorated, at least at the margin, in recent years.

Corporations account for about 55% of the national income that is currently produced in the United States. But other legal forms of business organization—largely proprietorships and partnerships— are important parts of the business sector as well. Specifically, non-corporate businesses accounted for $3.4 trillion of the $16.8 trillion in national income that was produced in the U.S. economy in 2017. In this report, we use the methodology we developed in our previous report to analyze the financial health of the non-financial non-corporate sector.


Individual Financial Metrics of the Non-Corporate Sector: A Mixed Bag

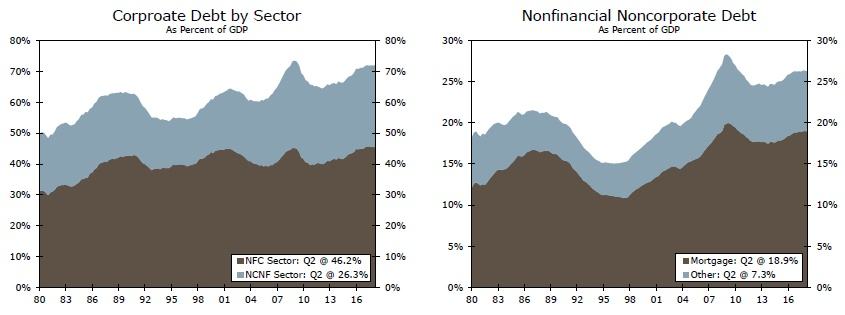
We noted in our previous report that the debt-to-GDP ratio of the NFC sector currently stands at an all-time high of 46%. The debt-to-GDP ratio of the NFNC sector has also trended gradually higher over the past few years to about 26 percent at present (Figure 1). Consequently, the debt-to- GDP ratio of the overall business sector is currently about a percentage point lower than its all-time high of nearly 74% that was set in Q1-2009. As shown in Figure 2, mortgages account for the lion's share of the outstanding debt of the NFNC sector. Mortgage debt among NFNC businesses ramped up significantly in the decade or so preceding the financial crisis, but mortgage debt in the sector is a bit lower today (as a percent of GDP) than it was about ten years ago.

Special Reports

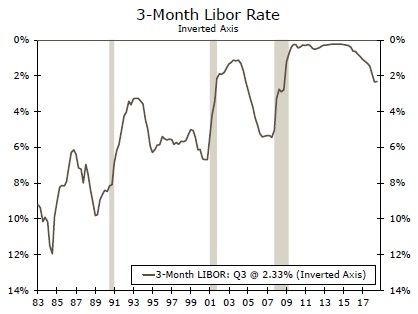
So what can we say about the financial health of the NFNC sector? Let's start by looking at each of the financial metrics we identified in our previous report. For starters, three-month LIBOR, which we use as a proxy for short-term interest rates, has risen due to the 200 bps of Fed tightening that has occurred over the past three years. Everything else equal, higher borrowing costs are associated with a deterioration in financial health (Figure 3)2.

Special Reports

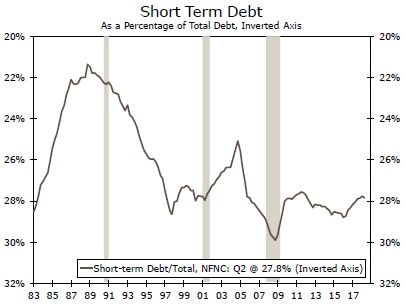
As noted above, mortgages, which are long-term debt, account for the majority of NFNC loans outstanding. Consequently, short-term debt comprises less than 30 percent of the overall debt profile of the NFNC sector, and this ratio has been generally stable over the past few years (Figure 4). Moreover, the generally low level of the ratio implies that NFNC businesses are not overly sensitive to rising interest rates on the short end of the yield curve.

Special Reports

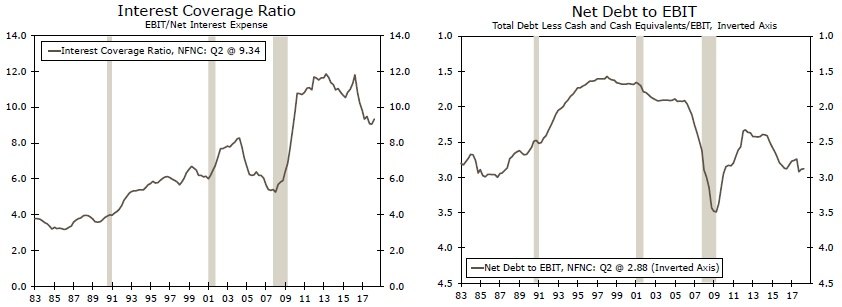
Nevertheless, the interest coverage ratio of the NFNC sector has slipped in recent quarters, which indicates some deterioration in the financial health of the NFNC sector, everything else equal (Figure 5). The ratio shot up markedly in the early years of the current expansion as proprietors' income rebounded sharply and as interest expenses receded due to accommodative monetary conditions. But interest expenses are rising now that the Fed has been tightening monetary policy over the past three years. Furthermore, the modest increase in leverage in the NFNC sector in recent years has led to some deterioration in the sector's net debt-to-EBIT ratio (Figure 6).

Special Reports

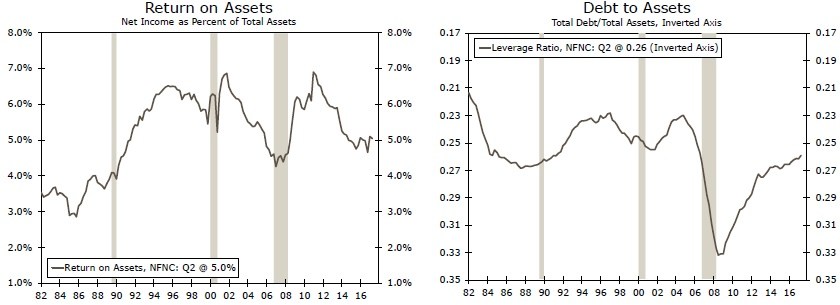
Real estate (both residential and non-residential) accounts for 60% of the assets in the NFNC sector, so real estate prices have had an influence on some of our financial metrics. On one hand, return on assets in the sector has trended lower in recent years as real estate values have risen (Figure 7). On the other hand, however, the rise in real estate prices has caused the value of assets to rise relative to the value of debt. Consequently, the debt-to-asset ratio of the NFNC sector has receded over the past few years, which implies an improvement in the sector's financial health, everything else equal (Figure 8).

Special Reports

Finally, the quick ratio (i.e., the ratio of current assets less inventories to short-term liabilities) of the NFNC sector has been essentially unchanged at a high level during the current expansion (Figure 9).

Special Reports

To recap, there are four metrics for the NFNC sector that have experienced some weakness in recent years (LIBOR, the interest coverage ratio, the net debt-to-EBIT ratio and return on assets). Two metrics have remained more or less unchanged (short-term debt as a percent of total debt, and the quick ratio). One metric has noticeably improved (the debt-to-asset ratio). Finally, there is one metric that we analyzed for the NFC sector that is not included in the analysis for the NFNC sector. Specifically, proprietorships and partnership do not have a market value for their equity (at least not easily observable), so we do not have a market-to-book ratio for the NFNC sector.


Should We Worry?

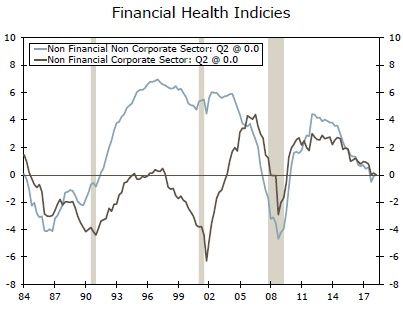
So where do these seven financial metrics leave us in regard to the overall financial health of NFNC businesses? Applying the same methodology that we used in our previous report, we constructed a financial health index for the NFNC sector (Figure 10). As we found with the NFC sector, there has been some deterioration in the financial health of NFNC businesses in recent years. Not only has net debt in the NFNC trended higher, but higher interest rates have pushed the interest coverage ratio lower. In addition, return on assets has also receded.

Special Reports

Our analysis suggests that the "high water mark" for the NFNC sector was reached in the mid-1990s through the middle years of the past decade. In those years, NFNC businesses had lower debt-toasset ratios as well as a lower net debt-to-EBIT ratio. The amount of short-term debt that they held (as a percentage of total debt) was a bit lower than it is today, and their return on assets was somewhat higher in those years.

That said, we are not overly concerned about the financial health of the NFNC sector at this time. The interest coverage ratio generally remains at a high level and NFNC businesses have plenty of current assets relative to their short-term liabilities (i.e., the quick ratio stands at a high level). But like the larger NFC sector, we will be keeping a close eye on the NFNC sector going forward for signs of further financial slippage.


Conclusion

Corporate sector debt has come under the microscope recently, but debt has also been increasing among non-corporate businesses. Although a number of measures of the health of the NFNC sector look to be in fairly good shape, finances have deteriorated modestly over the past few years. Similar to the corporate sector, higher interest rates have contributed to a decline in interest coverage, while earnings have not kept pace with new debt. As a result, the non-corporate business sector appears to be a bit more vulnerable to a slowdown or shock to the economy than it was a few years ago.

As the Fed continues to raise rates and profits come under pressure as growth slows, we would expect to see further weakening in the health of the non-corporate sector. Further deterioration could limit the NFNC sector's wherewithal to invest and hire, as well as weigh on the banking system if the sector has difficulty paying back loans. Accordingly, we will be paying close attention to the health of the non-corporate sector in addition to the corporate sector.

Download The Full Special Reports

Recently, the stock market has experienced high levels of volatility. If you are thinking about participating in fast moving markets, please take the time to read the information below. Wells Fargo Investments, LLC will not be restricting trading on fast moving securities, but you should understand that there can be significant additional risks to trading in a fast market. We've tried to outline the issues so you can better understand the potential risks. If you're unsure about the risks of a fast market and how they may affect a particular trade you've considering, you may want to place your trade through a phone agent at 1-800-TRADERS. The agent can explain the difference between market and limit orders and answer any questions you may have about trading in volatile markets. Higher Margin Maintenance Requirements on Volatile Issues The wide swings in intra-day trading have also necessitated higher margin maintenance requirements for certain stocks, specifically Internet, e-commerce and high-tech issues. Due to their high volatility, some of these stocks will have an initial and a maintenance requirement of up to 70%. Stocks are added to this list daily based on market conditions. Please call 1-800-TRADERS to check whether a particular stock has a higher margin maintenance requirement. Please note: this higher margin requirement applies to both new purchases and current holdings. A change in the margin requirement for a current holding may result in a margin maintenance call on your account. Fast Markets A fast market is characterized by heavy trading and highly volatile prices. These markets are often the result of an imbalance of trade orders, for example: all "buys" and no "sells." Many kinds of events can trigger a fast market, for example a highly anticipated Initial Public Offering (IPO), an important company news announcement or an analyst recommendation. Remember, fast market conditions can affect your trades regardless of whether they are placed with an agent, over the internet or on a touch tone telephone system. In Fast Markets service response and account access times may vary due to market conditions, systems performance, and other factors. Potential Risks in a Fast Market "Real-time" Price Quotes May Not be Accurate Prices and trades move so quickly in a fast market that there can be significant price differences between the quotes you receive one moment and the next. Even "real-time quotes" can be far behind what is currently happening in the market. The size of a quote, meaning the number of shares available at a particular price, may change just as quickly. A real-time quote for a fast moving stock may be more indicative of what has already occurred in the market rather than the price you will receive. Your Execution Price and Orders Ahead In a fast market, orders are submitted to market makers and specialists at such a rapid pace, that a backlog builds up which can create significant delays. Market makers may execute orders manually or reduce size guarantees during periods of volatility. When you place a market order, your order is executed on a first-come first-serve basis. This means if there are orders ahead of yours, those orders will be executed first. The execution of orders ahead of yours can significantly affect your execution price. Your submitted market order cannot be changed or cancelled once the stock begins trading. Initial Public Offerings may be Volatile IPOs for some internet, e-commerce and high tech issues may be particularly volatile as they begin to trade in the secondary market. Customers should be aware that market orders for these new public companies are executed at the current market price, not the initial offering price. Market orders are executed fully and promptly, without regard to price and in a fast market this may result in an execution significantly different from the current price quoted for that security. Using a limit order can limit your risk of receiving an unexpected execution price. Large Orders in Fast Markets Large orders are often filled in smaller blocks. An order for 10,000 shares will sometimes be executed in two blocks of 5,000 shares each. In a fast market, when you place an order for 10,000 shares and the real-time market quote indicates there are 15,000 shares at 5, you would expect your order to execute at 5. In a fast market, with a backlog of orders, a real-time quote may not reflect the state of the market at the time your order is received by the market maker or specialist. Once the order is received, it is executed at the best prices available, depending on how many shares are offered at each price. Volatile markets may cause the market maker to reduce the size of guarantees. This could result in your large order being filled in unexpected smaller blocks and at significantly different prices. For example: an order for 10,000 shares could be filled as 2,500 shares at 5 and 7,500 shares at 10, even though you received a real-time quote indicating that 15,000 shares were available at 5. In this example, the market moved significantly from the time the "real-time" market quote was received and when the order was submitted. Online Trading and Duplicate Orders Because fast markets can cause significant delays in the execution of a trade, you may be tempted to cancel and resubmit your order. Please consider these delays before canceling or changing your market order, and then resubmitting it. There is a chance that your order may have already been executed, but due to delays at the exchange, not yet reported. When you cancel or change and then resubmit a market order in a fast market, you run the risk of having duplicate orders executed. Limit Orders Can Limit Risk A limit order establishes a "buy price" at the maximum you're willing to pay, or a "sell price" at the lowest you are willing to receive. Placing limit orders instead of market orders can reduce your risk of receiving an unexpected execution price. A limit order does not guarantee your order will be executed -" however, it does guarantee you will not pay a higher price than you expected. Telephone and Online Access During Volatile Markets During times of high market volatility, customers may experience delays with the Wells Fargo Online Brokerage web site or longer wait times when calling 1-800-TRADERS. It is possible that losses may be suffered due to difficulty in accessing accounts due to high internet traffic or extended wait times to speak to a telephone agent. Freeriding is Prohibited Freeriding is when you buy a security low and sell it high, during the same trading day, but use the proceeds of its sale to pay for the original purchase of the security. There is no prohibition against day trading, however you must avoid freeriding. To avoid freeriding, the funds for the original purchase of the security must come from a source other than the sale of the security. Freeriding violates Regulation T of the Federal Reserve Board concerning the extension of credit by the broker-dealer (Wells Fargo Investments, LLC) to its customers. The penalty requires that the customer's account be frozen for 90 days. Stop and Stop Limit Orders A stop is an order that becomes a market order once the security has traded through the stop price chosen. You are guaranteed to get an execution. For example, you place an order to buy at a stop of $50 which is above the current price of $45. If the price of the stock moves to or above the $50 stop price, the order becomes a market order and will execute at the current market price. Your trade will be executed above, below or at the $50 stop price. In a fast market, the execution price could be drastically different than the stop price. A "sell stop" is very similar. You own a stock with a current market price of $70 a share. You place a sell stop at $67. If the stock drops to $67 or less, the trade becomes a market order and your trade will be executed above, below or at the $67 stop price. In a fast market, the execution price could be drastically different than the stop price. A stop limit has two major differences from a stop order. With a stop limit, you are not guaranteed to get an execution. If you do get an execution on your trade, you are guaranteed to get your limit price or better. For example, you place an order to sell stock you own at a stop limit of $67. If the stock drops to $67 or less, the trade becomes a limit order and your trade will only be executed at $67 or better. Glossary All or None (AON) A stipulation of a buy or sell order which instructs the broker to either fill the whole order or don't fill it at all; but in the latter case, don't cancel it, as the broker would if the order were filled or killed. Day Order A buy or sell order that automatically expires if it is not executed during that trading session. Fill or Kill An order placed that must immediately be filled in its entirety or, if this is not possible, totally canceled. Good Til Canceled (GTC) An order to buy or sell which remains in effect until it is either executed or canceled (WellsTrade® accounts have set a limit of 60 days, after which we will automatically cancel the order). Immediate or Cancel An order condition that requires all or part of an order to be executed immediately. The part of the order that cannot be executed immediately is canceled. Limit Order An order to buy or sell a stated quantity of a security at a specified price or at a better price (higher for sales or lower for purchases). Maintenance Call A call from a broker demanding the deposit of cash or marginable securities to satisfy Regulation T requirements and/or the House Maintenance Requirement. This may happen when the customer's margin account balance falls below the minimum requirements due to market fluctuations or other activity. Margin Requirement Minimum amount that a client must deposit in the form of cash or eligible securities in a margin account as spelled out in Regulation T of the Federal Reserve Board. Reg. T requires a minimum of $2,000 or 50% of the purchase price of eligible securities bought on margin or 50% of the proceeds of short sales. Market Makers NASD member firms that buy and sell NASDAQ securities, at prices they display in NASDAQ, for their own account. There are currently over 500 firms that act as NASDAQ Market Makers. One of the major differences between the NASDAQ Stock Market and other major markets in the U.S. is NASDAQ's structure of competing Market Makers. Each Market Maker competes for customer order flow by displaying buy and sell quotations for a guaranteed number of shares. Once an order is received, the Market Maker will immediately purchase for or sell from its own inventory, or seek the other side of the trade until it is executed, often in a matter of seconds. Market Order An order to buy or sell a stated amount of a security at the best price available at the time the order is received in the trading marketplace. Specialists Specialist firms are those securities firms which hold seats on national securities exchanges and are charged with maintaining orderly markets in the securities in which they have exclusive franchises. They buy securities from investors who want to sell and sell when investors want to buy. Stop An order that becomes a market order once the security has traded through the designated stop price. Buy stops are entered above the current ask price. If the price moves to or above the stop price, the order becomes a market order and will be executed at the current market price. This price may be higher or lower than the stop price. Sell stops are entered below the current market price. If the price moves to or below the stop price, the order becomes a market order and will be executed at the current market price. Stop Limit An order that becomes a limit order once the security trades at the designated stop price. A stop limit order instructs a broker to buy or sell at a specific price or better, but only after a given stop price has been reached or passed. It is a combination of a stop order and a limit order. These articles are for information and education purposes only. You will need to evaluate the merits and risks associated with relying on any information provided. Although this article may provide information relating to approaches to investing or types of securities and investments you might buy or sell, Wells Fargo and its affiliates are not providing investment recommendations, advice, or endorsements. Data have been obtained from what are considered to be reliable sources; however, their accuracy, completeness, or reliability cannot be guaranteed. Wells Fargo makes no warranties and bears no liability for your use of this information. The information made available to you is not intended, and should not be construed as legal, tax, or investment advice, or a legal opinion.

Recommended Content


Recommended Content

Editors’ Picks

EUR/USD regains traction, recovers above 1.0700

EUR/USD regains traction, recovers above 1.0700

EUR/USD regained its traction and turned positive on the day above 1.0700 in the American session. The US Dollar struggles to preserve its strength after the data from the US showed that the economy grew at a softer pace than expected in Q1.

EUR/USD News

GBP/USD returns to 1.2500 area in volatile session

GBP/USD returns to 1.2500 area in volatile session

GBP/USD reversed its direction and recovered to 1.2500 after falling to the 1.2450 area earlier in the day. Although markets remain risk-averse, the US Dollar struggles to find demand following the disappointing GDP data.

GBP/USD News

Gold climbs above $2,340 following earlier drop

Gold climbs above $2,340 following earlier drop

Gold fell below $2,320 in the early American session as US yields shot higher after the data showed a significant increase in the US GDP price deflator in Q1. With safe-haven flows dominating the markets, however, XAU/USD reversed its direction and rose above $2,340.

Gold News

XRP extends its decline, crypto experts comment on Ripple stablecoin and benefits for XRP Ledger

XRP extends its decline, crypto experts comment on Ripple stablecoin and benefits for XRP Ledger

Ripple extends decline to $0.52 on Thursday, wipes out weekly gains. Crypto expert asks Ripple CTO how the stablecoin will benefit the XRP Ledger and native token XRP. 

Read more

After the US close, it’s the Tokyo CPI

After the US close, it’s the Tokyo CPI

After the US close, it’s the Tokyo CPI, a reliable indicator of the national number and then the BoJ policy announcement. Tokyo CPI ex food and energy in Japan was a rise to 2.90% in March from 2.50%.

Read more

Majors

Cryptocurrencies

Signatures