Analyzing inter-market correlations to see if reflation trade is coming to an end – July 2021
- Positive correlation between 10-year US T-bond yield and S&P 500 is at its strongest level in a year.
- Coronavirus Delta variant and inflation concerns could cause a shift in market sentiment.
- USD is likely to outperform its risk-sensitive rivals if reflation trade loses interest.

Prospects of a strong global economic recovery on the back of drugmakers’ success to produce effective vaccines against the coronavirus triggered the so-called “reflation trade” in late 2020. Major central banks’ unprecedented support via ultra-loose monetary policy and fiscal stimulus measures to revive consumer spending reaffirmed investors that the days of extremely low inflation would finally come to an end.
During that period, investors looked for high-yielding assets and Wall Street’s main indexes rallied to record highs. In the first half of 2021, the S&P 500 Index gained nearly 14%. In the meantime, safe-haven Treasury bonds struggled to attract investors and the yield on the benchmark 10-year reference retraced the sharp decline it suffered during the intense flight to safety seen at the beginning of the coronavirus crisis. Although the US Dollar Index (DXY) rose 3.6% in the first quarter as rising bond yields helped the USD find demand, it erased its gains in the second quarter with risk flows continuing to dominate the markets.
However, the market sentiment started to change after the US Federal Reserve acknowledged that inflation could stay high for longer than initially estimated. In fact, the Fed’s updated Summary of Projections revealed in June that the number of policymakers who see a lift-off in the fed funds rate from zero in 2022 rose to seven from four. Confirming the hawkish tilt in the policy outlook, FOMC Chairman Jerome Powell noted that policymakers were set to begin discussions around asset tapering. Additionally, revived concerns over the coronavirus Delta variant crippling the economic rebound forced investors to reassess their positions.
Is the reflation trade coming to an end?
In order to figure out if the reflation trade still is the main market theme, we have analyzed inter-market correlations and tried to spot an apparent shift in pricing.
We have plotted the daily change in the DXY, 10-year US T-bond yield and the S&P 500 for the past 300 trading days and calculated the correlation coefficient. Suffice it to say, the results were insignificant. The correlation coefficient (r) between the DXY and the 10-year yield was -0.06, it was -0.32 between the DXY and the S&P 500 and it was 0.22 between the 10-year yield and the S&P 500. Next, we have isolated those correlation coefficients on a monthly basis and looked for a shift in trend.
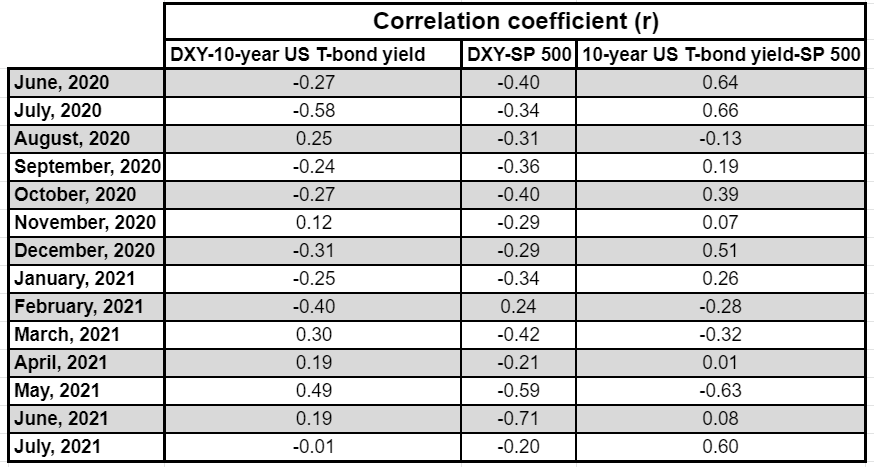
For instance, the correlation coefficient between the DXY and the 10-year yields was 0.3, 0.19, 0.49 and 0.19 in March, April, May and June, respectively. During that time frame, the USD was gathering strength against its major rivals when yields were rising and vice versa. This suggests that investors were pricing inflation expectations and yield differentials. In July, however, this number declined to -0.01, showing that the positive correlation has disappeared. This could be caused by investors seeking refuge in Treasury bonds and the USD, weighing on yields and supporting the DXY.
In the meantime, the r between the 10-year US T-bond yield and the S&P 500 climbed to its strongest level in a year in July at 0.6 from 0.08 in June. So far in July, there is a strong positive correlation between the S&P 500’s daily change and the daily change in the 10-year US T-bond yields. When the S&P 500 falls, T-bond yields also decline, confirming the view that risk perception is the primary factor investors are looking at when making trading decisions in July.
Finally, the negative correlation between the DXY and the S&P 500 Index remains intact in July, albeit turning less significant than it was in June. As we have mentioned above, the positive correlation between the 10-year yield and the S&P 500 turned relatively significant in July. A decline in US stocks accompanied by a decline in yields is a sign of flight-to-safety. Although the greenback is generally seen as a safe haven, falling yields seem to be limiting the currency’s gains against its rivals.

Conclusion
It’s still too early to say that the reflation trade is over. After closing in the negative territory for five straight trading days, from July 13 to July 19 and losing nearly 3% during that time span, the S&P 500 Index staged an impressive rebound and reached a new all-time high of 4,415 on July 23.
In case a steady decline in US stocks triggers a bearish shift in the medium-term trend and US T-bond yields remain on the back foot, we should see the positive correlation between those two markets strengthening and staying significant. In turn, the USD could be expected to outperform its risk-sensitive rivals, such as the AUD, CAD and the NZD. Against the JPY, the USD’s gains are likely to be limited due to the shrinking interest rate differential and the JPY’s safe-haven status. Thus, the correlation between the DXY and the 10-year yield is unlikely to turn positive.
Author

Eren Sengezer
FXStreet
As an economist at heart, Eren Sengezer specializes in the assessment of the short-term and long-term impacts of macroeconomic data, central bank policies and political developments on financial assets.


