AI worries cause US tech shares to tumble

USD slides, while ECB and BoJ remain hawkishly on hold
ECB yesterday remained on hold as expected, yet the main issue may not have been its monetary policy but the resignation of ECB President Lagarde who is to step down in February 27, five months before the end of her term. During today’s Asian session, BoJ kept rates unchanged as expected, upward revising its inflation forecast in a subtle hawkish signal for the markets. Today we note the release of Germany’s preliminary HICP rate for October as a possible market mover for EUR. In the US neither the Fed’s hawkish stance nor the better than expected GDP rate were supported the greenback, characteristically forcing the USD to a six week low against its northern neighbour, the CAD as the gap between US and Canadian yields narrows.
Alphabet tumbles, Intel, Amazon set to follow
Alphabet shed 12.5% after the weak earnings report released on Wednesday’s aftermarket hours. Also, Amazon undershot the market’s expectations both on an EPS and revenue figure while Intel issued a weak forward guidance. Amazon is expected to shed 7% and Intel to lose possibly 22% of its value. It looks more and more like US tech companies bit off more than what they can chew, AI investment wise. The developments seem to be weighing on the market sentiment which in turn may cause US stock markets to lose ground as the week is about to end.
Gold’s price edges lower
Gold’s price edged lower yesterday and on a fundamental level, the rise of oil prices tended to enhance market worries for inflationary pressures in the US economy and thus weighing on the precious metal’s price. Also, the higher growth and inflation data of the US released yesterday tend to bolster the possibility of a rate hike in the Fed’s December meeting. Should we see the market worries for high oil prices and their effect on inflationary pressures be enhanced we may see gold’s price losing more ground.
Oil prices on the rise again
Oil prices were on the rise again and fundamentally, the attack on an oil tanker in the Strait of Hormuz underscores the tensions in the Gulf region and the inherent risks for the supply side of the international oil market. Also we remind our readers that the US warned its allies about an imminent, short but intense attack on Iran after the US elections on the 3rd of November. Please note that Chevron and Exxon Mobil executives have cancelled their trips to the ADIPEC oil expo in Abu Dhabi (UAE) next week. Should market worries intensify further, we may see oil prices gaining more ground and vice versa. On the other hand diplomatic efforts are still ongoing which may ease market worries.
Other highlights for today
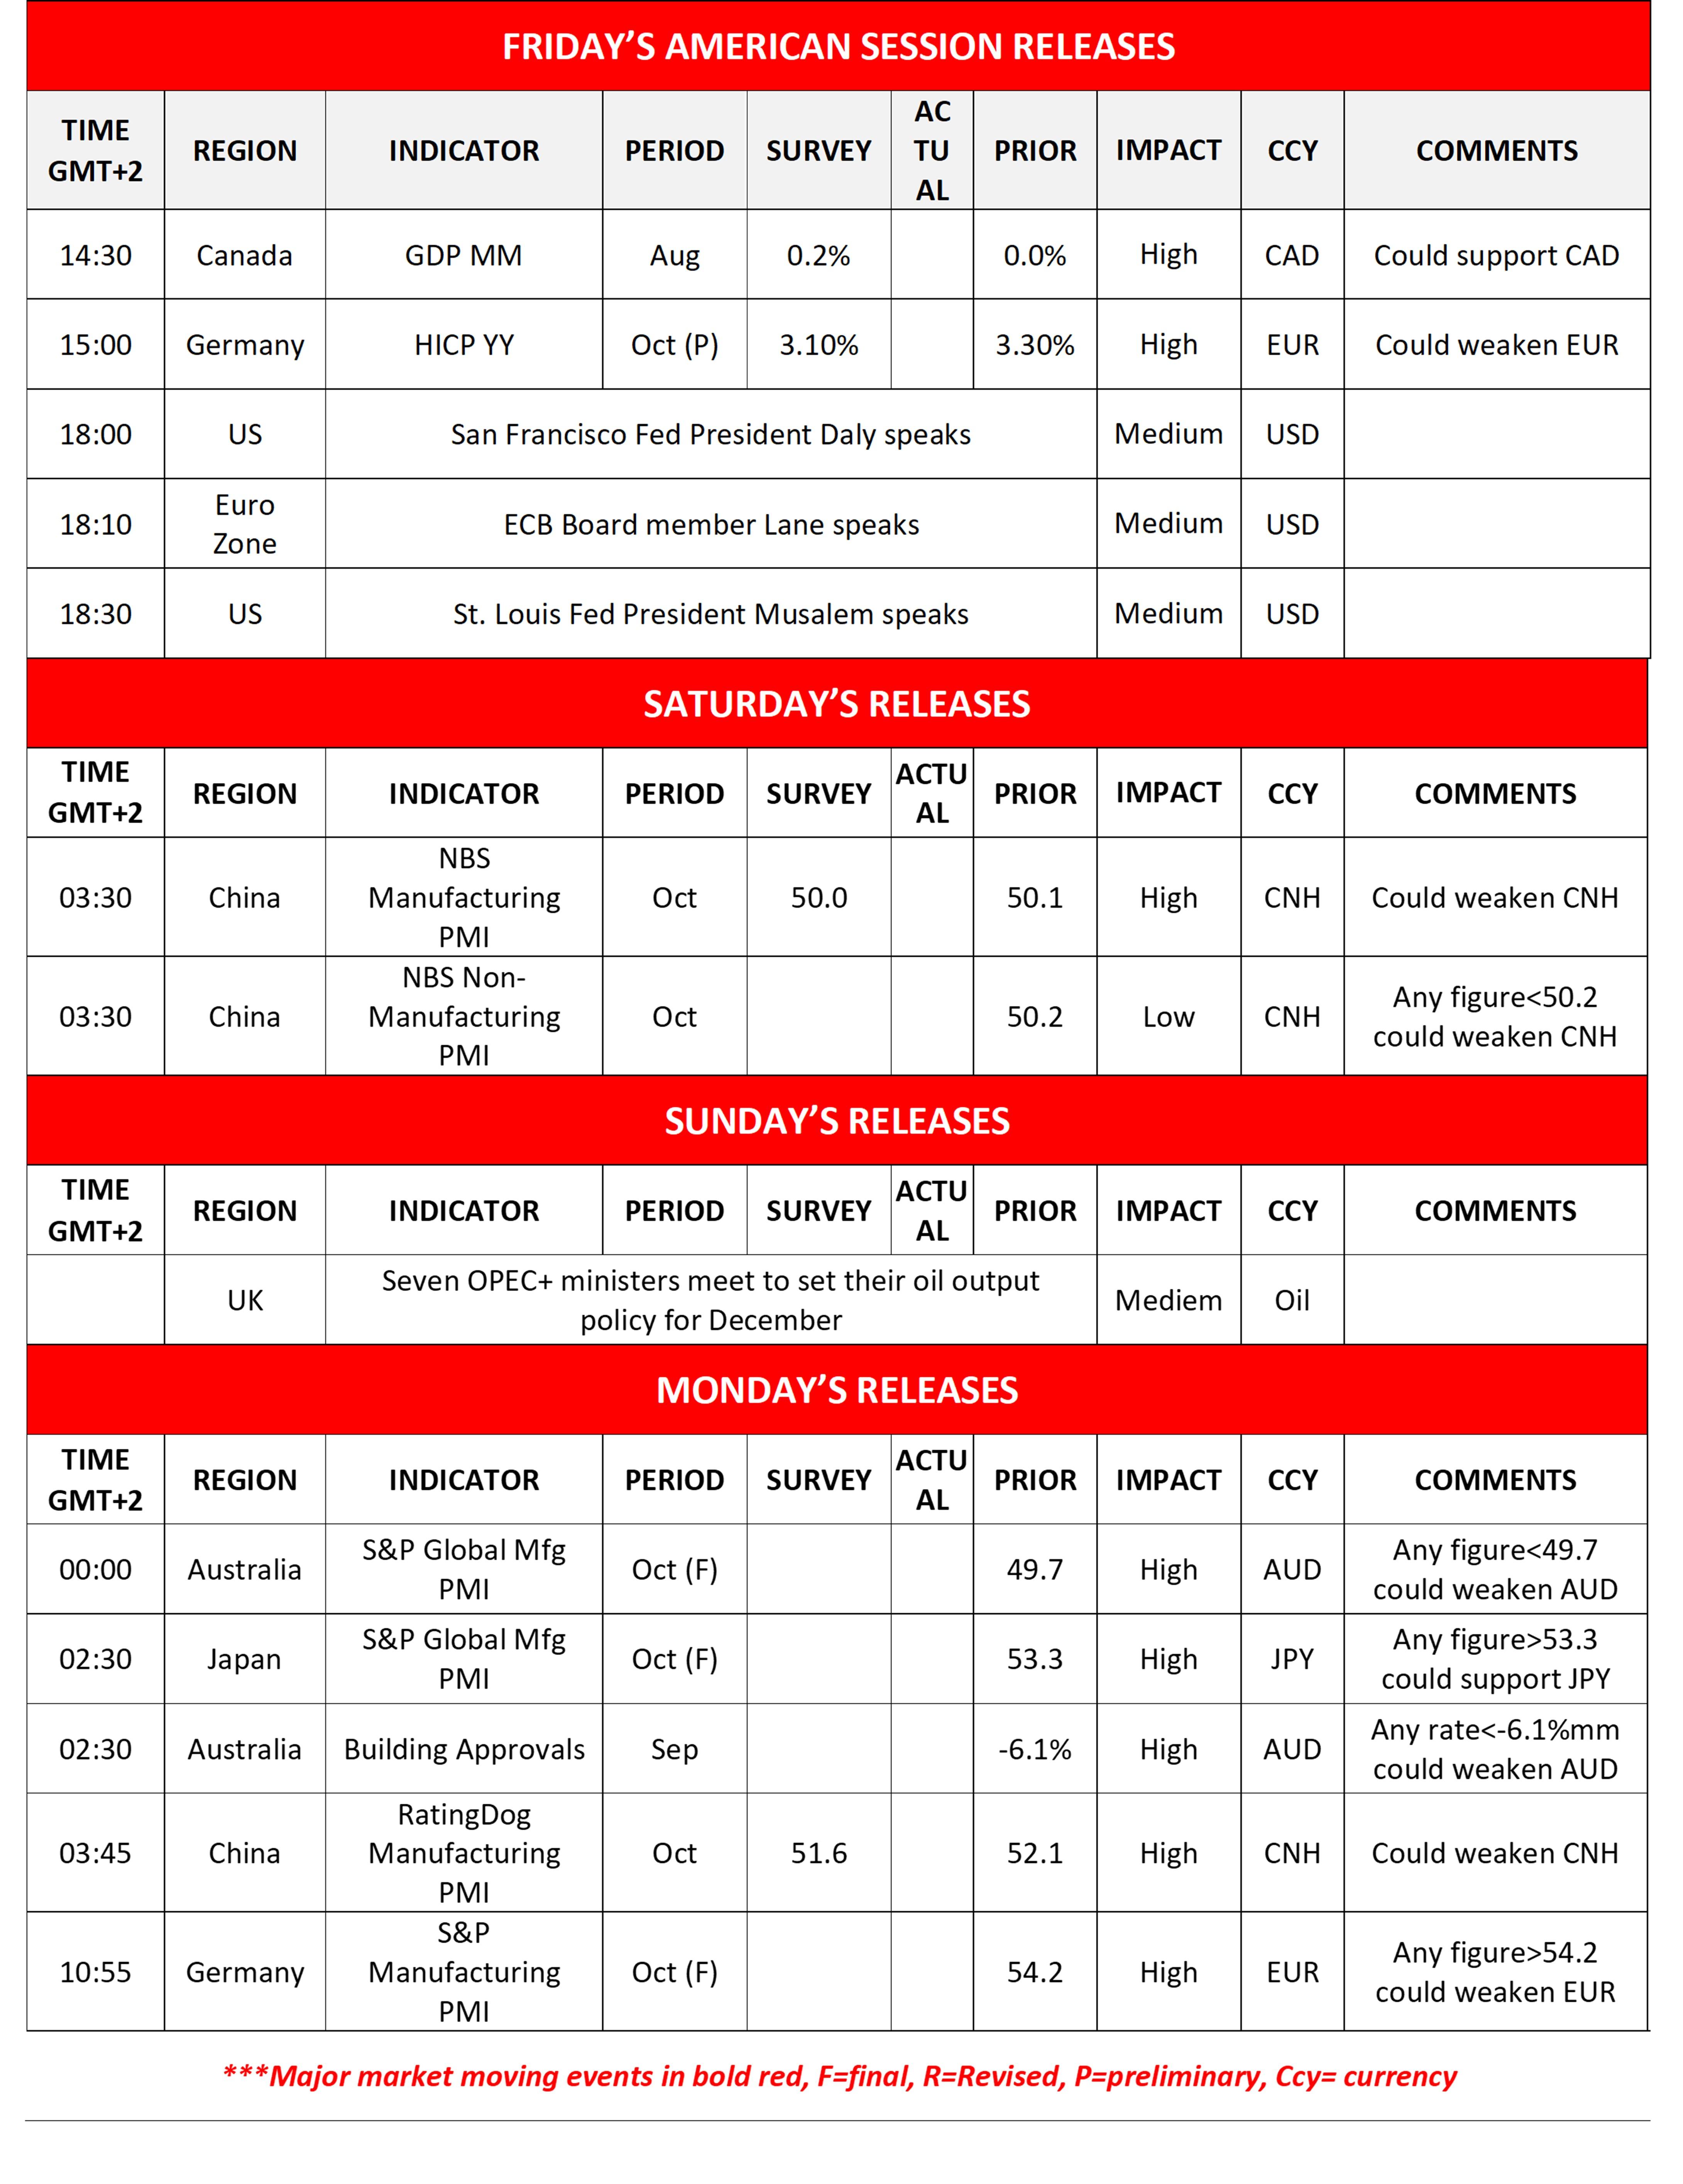
Today we get Canada’s GDP rates for August and on Monday, we get Australia’s building approvals for September, and Australia’s, Japan’s China’s and Germany’s manufacturing PMI figures for October.
Charts to keep an eye out
Nasdaq continued to drop, teasing the 28750 (S1) support line. We note that the downward trendline was clearly broken on Tuesday, yet the bearish tendencies of the index seem to have been renewed. The RSI indicator has dropped aiming for the reading of 30, implying an intensifying bearish market sentiment for the index. For the time being, S1 seems to be still holding and for us to switch our sideways movement bias, we would require the index to clearly break the 28750 (S1) support line and start actively aiming for the 27050 (S2) support level. Should the bulls take over, we may see the index reversing the losses of the past two days break the 29735 (R1) resistance line opening the gates for the 30770 (R2) resistance hurdle.
WTI’s price action yesterday, moved clearly above the 101.00 (S1) resistance line now turned to support. The commodity’s price action revived the bullish outlook given also that the RSI indicator rose nearing once again the reading of 70, implying an intensification of the bullish market sentiment. Should the bulls remain in control, we may see WTI’s price action aiming if not breaking the 108.85 (R1) line. Should the bears take over, we may see WTI breaking the 101.00 (S1) line and start aiming for the 94.30 (S2) level.
Calendar follows
US 100 Cash daily chart
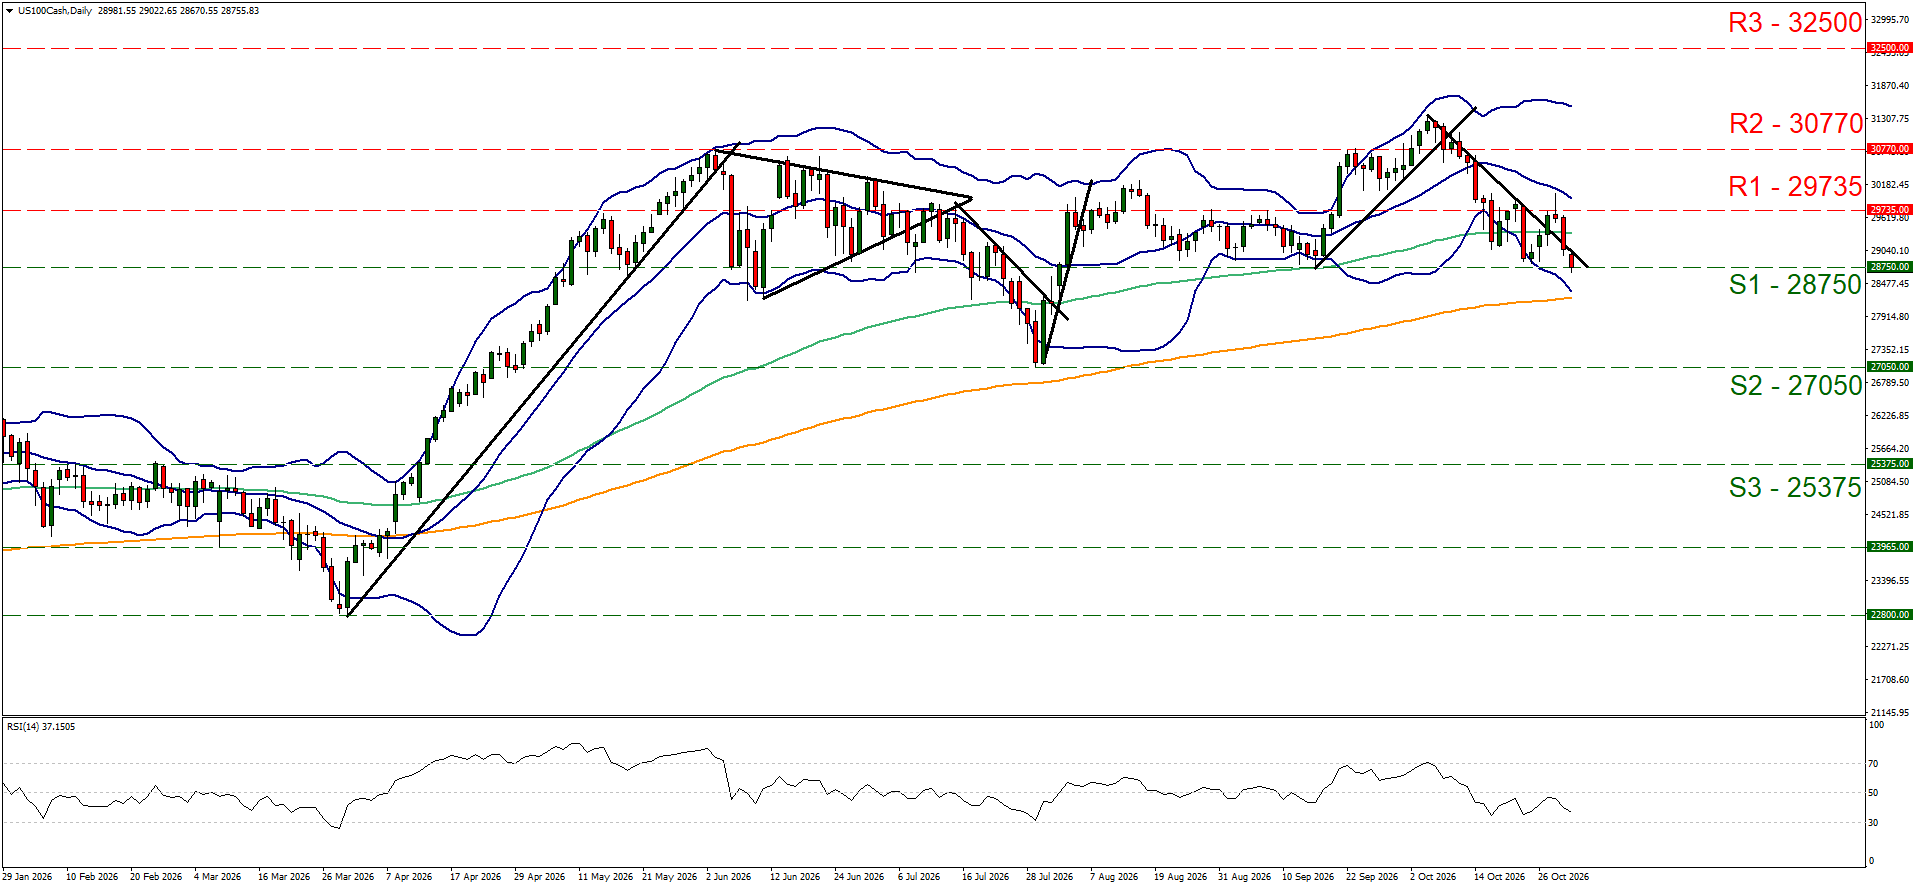
- Support: 28750 (S1), 27050 (S2), 25375 (S3).
- Resistance: 29735 (R1), 30770 (R2), 32500 (R3).
WTI daily chart
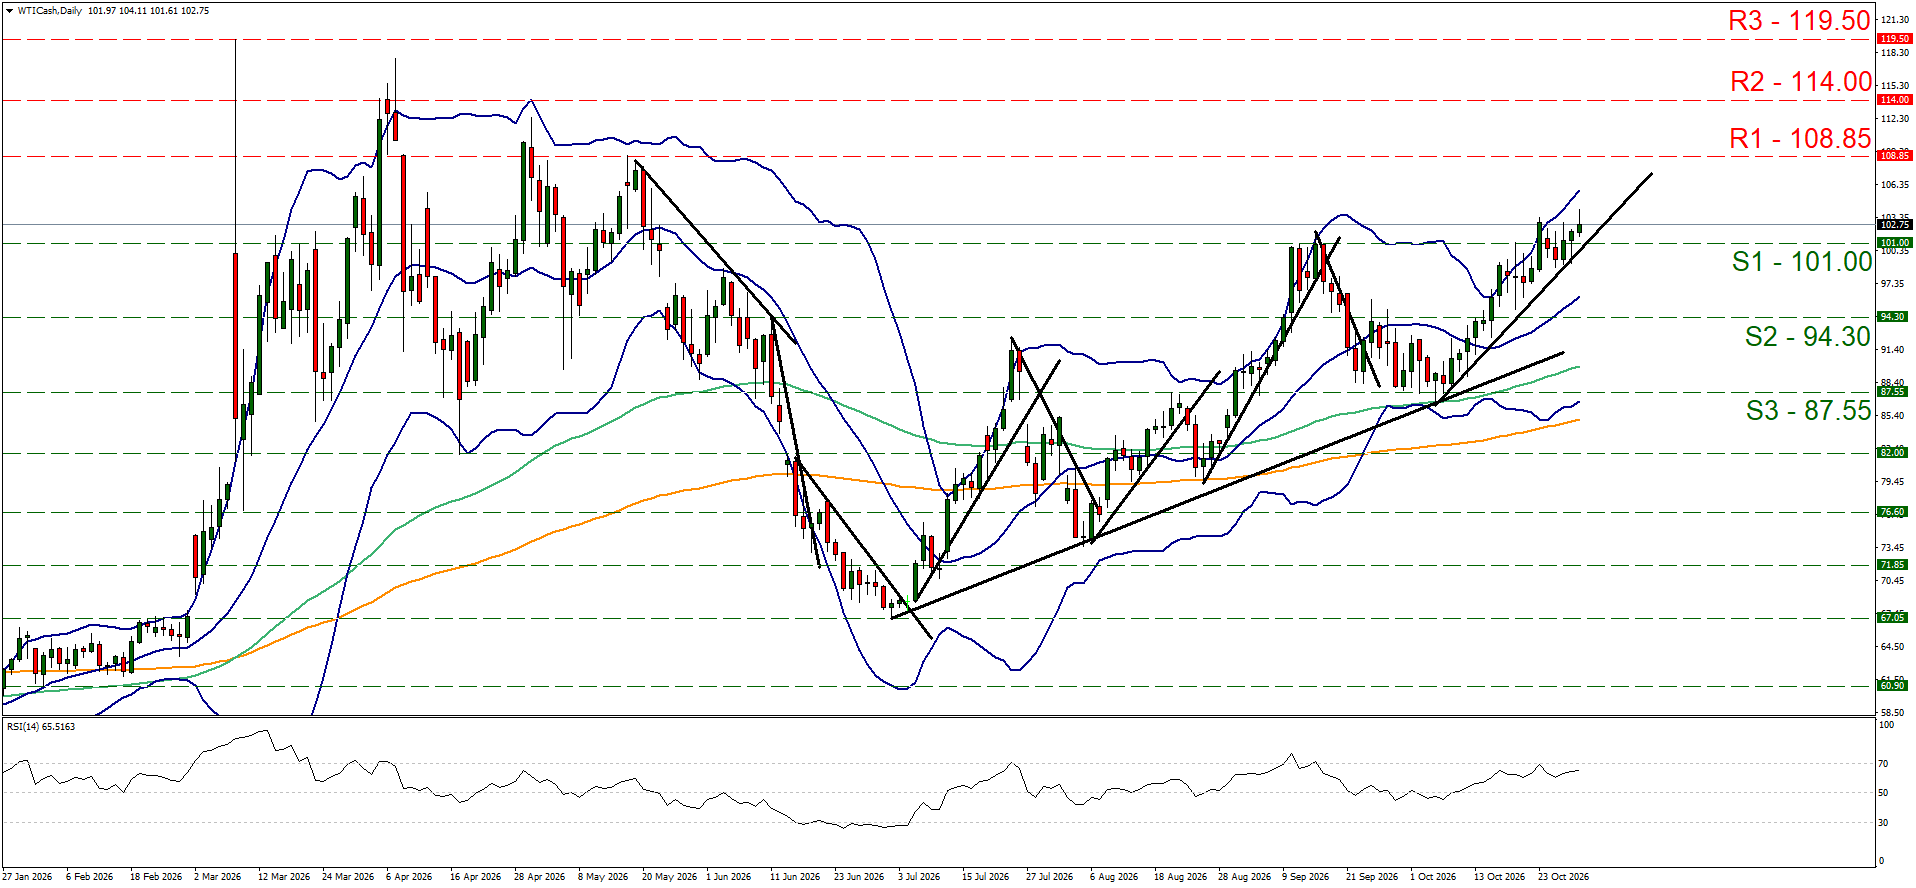
- Support: 101.00 (S1), 94.30 (S2), 87.55 (S3).
- Resistance: 108.85 (R1), 114.00 (R2), 119.50 (R3).
Author

Peter Iosif, ACA, MBA
IronFX
Mr. Iosif joined IronFX in 2017 as part of the sales force. His high level of competence and expertise enabled him to climb up the company ladder quickly and move to the IronFX Strategy team as a Research Analyst. Mr.