ZM Elliott Wave technical analysis [Video]
![ZM Elliott Wave technical analysis [Video]](https://editorial.fxsstatic.com/images/i/Computer-with-Chart_1_XtraLarge.png)
ZM Elliott Wave technical analysis
Function: Counter trend.
Mode: Corrective.
Structure: Complex Correction.
Position: Wave (Y) of {B}
Direction: Downtrend.
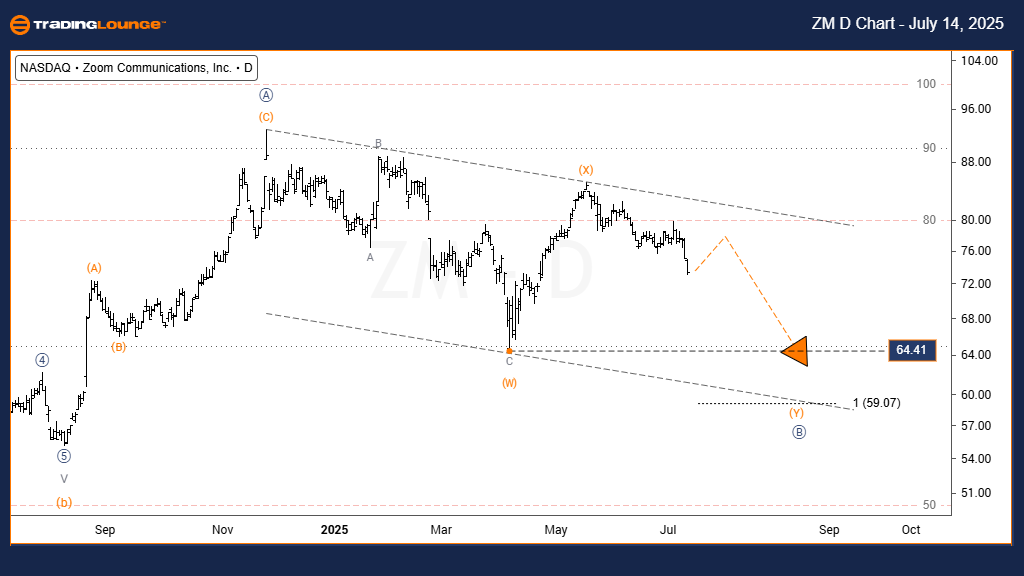
Details: Price is unfolding within a parallel channel as Wave (Y) develops; Waves (W) and (X) are complete.
Zoom Communications Inc. (ZM) is currently progressing through a complex W–X–Y corrective pattern on the daily chart. Waves (W) and (X) have completed their formation, and the market is now in Wave (Y), unfolding within a clearly defined parallel channel.
This setup aligns with the internal structure of Wave {B}, suggesting the retracement is progressing in an orderly manner. Based on Fibonacci projections, Wave (Y) could reach its termination near the 100% extension of Wave (W), which also aligns with the lower boundary of the channel—serving as potential support.
The current correction remains valid as long as price does not exceed the origin of Wave (W).
ZM Elliott Wave technical analysis
Function: Countertrend.
Mode: Corrective.
Structure: Double Three/Complex Correction.
Position: Wave {B}.
Direction: Downtrend.
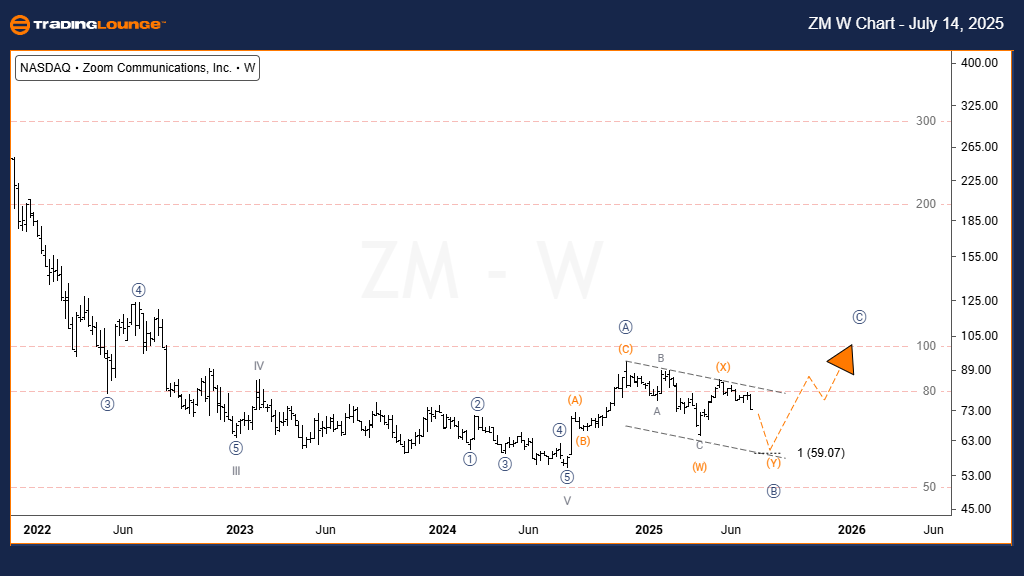
Details: Higher-degree correction continues as a W–X–Y structure. Wave {C} is anticipated after the completion of Wave (Y).
The weekly chart reveals that ZM is experiencing a higher-degree corrective phase, forming a double three W–X–Y structure identified as Wave {B}. The internal compositions of Waves (W) and (X) are clearly visible on the daily timeframe.
The unfolding of Wave (Y) aligns with the broader corrective logic, confirming that the structure is adhering to Elliott Wave guidelines. After Wave (Y) completes, the pattern is expected to transition into an impulsive Wave {C}, indicating a potential bullish reversal following the conclusion of the correction.
The proportion between Waves (W) and (Y), along with the principle of alternation, supports the integrity of this wave count.
ZM Elliott Wave technical analysis [Video]
Author

Peter Mathers
TradingLounge
Peter Mathers started actively trading in 1982. He began his career at Hoei and Shoin, a Japanese futures trading company.


