|

XOM Elliott Wave view: Soon longs should be risk free

In this technical blog, we will look at the past performance of the 4hr Elliott Wave Charts of XOM. In which, the rally from the 23 March 2020 low is unfolding as an impulse and showed a higher high sequence. Therefore, we knew that the structure in XOM is incomplete to the upside for 1 more high & should see more upside. So, we advised members not to sell the stock & buy the dips in 3, 7, or 11 swings at the blue box areas. We will explain the structure & forecast below:

XOM 4 hour Elliott Wave chart

XOM

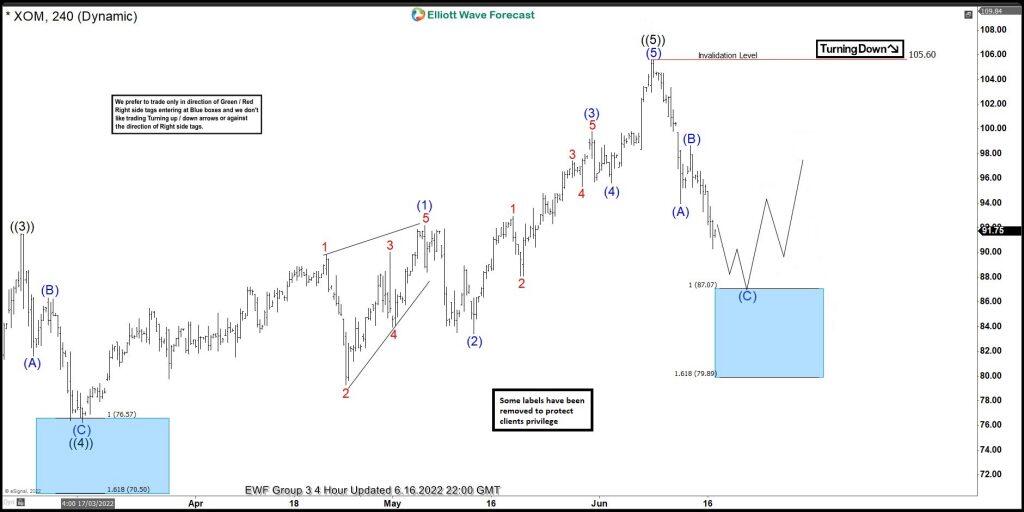
Here’s the Elliott wave Chart from the 6/12/2022 update. In which, the rally to $105.60 high ended the cycle from the 19 August 2021 low in wave III & made a pullback in wave IV. The internals of that pullback unfolded as Elliott wave zigzag structure where wave (A) ended at $93.92 low. Then a bounce to $98.67 high ended wave (B) & started the next leg lower in wave (C) towards $87.07- $79.89 blue box area. From there, buyers were expected to appear looking for new highs ideally or for a 3 wave bounce minimum.

XOM latest 4hr Elliott Wave chart

XOM

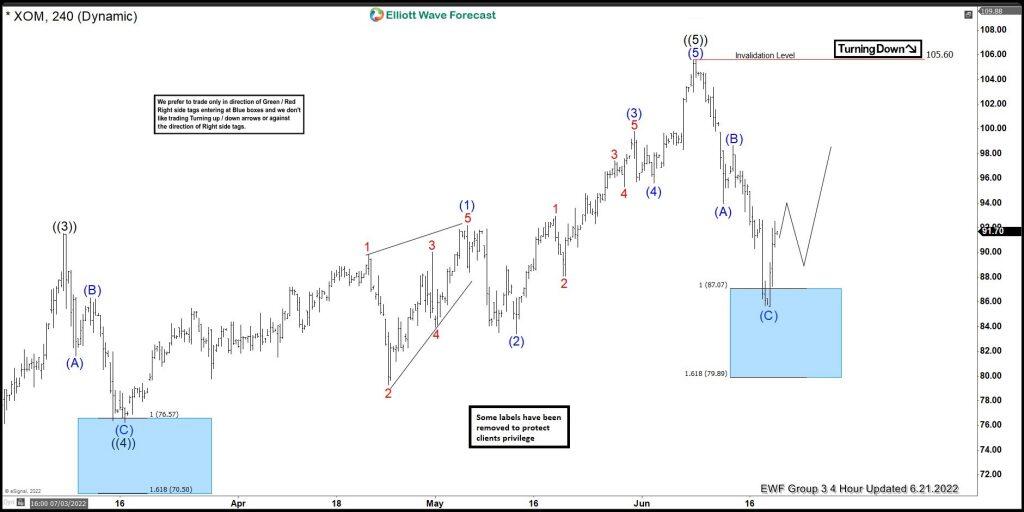
Above is the latest Elliott wave Chart from the 6/21/2022 update. In which the stock is showing a reaction higher taking place from the blue box area at $87.07- $79.89. Right after ending the zigzag correction within the blue box area. Allowed members to create a risk-free position with the minimum reaction higher towards 50%- 61.8% Fibonacci retracement from the wave (B) peak at $92.11- $93.66 area. However, a break above $105.60 high is still needed to confirm the next extension higher & avoid double correction lower.

Author

Elliott Wave Forecast Team

Elliott Wave Forecast Team

ElliottWave-Forecast.com

More from Elliott Wave Forecast Team
Share:

Editor's Picks

EUR/USD remains depressed below mid-1.1800s; downside potential seems limited

The EUR/USD pair attracts some sellers for the second consecutive day on Tuesday and hovers below mid-1.1800s amid a relatively quiet trading action during the Asian session. The broader fundamental backdrop, however, warrants some caution for bearish traders before positioning for deeper losses.

GBP/USD trades with negative bias, eyes 1.3600 ahead of UK jobs data

The GBP/USD pair trades with a negative bias for the second straight day, though it lacks bearish conviction and holds above the 1.3600 mark through the Asian session on Tuesday. Traders now look forward to the release of the UK monthly jobs report, which will influence the British Pound and provide some impetus to the currency pair.

Gold declines as trading volumes remain subdued due to holidays in China

Gold price extends its losses for the second successive session, trading around $4,930 per troy ounce during the Asian hours on Tuesday. Gold price is trading nearly 0.7% lower at the time of writing as trading volumes stayed thin due to market holidays across China, Hong Kong, and other parts of Asia.

Top Crypto Gainers: Stable, MemeCore and Nexo rally test critical resistance levels

Stable, MemeCore, and Nexo are among the leading gainers in the crypto market over the last 24 hours, while Bitcoin remains below $70,000, suggesting renewed interest in altcoins among investors.

The week ahead: Key inflation readings and why the AI trade could be overdone

It is likely to be a quiet start to the week, with US markets closed on Monday for Presidents Day. European markets are higher across the board and gold is clinging to the $5,000 level after the tamer than expected CPI report in the US reduced haven flows to precious metals.

XRP steadies in narrow range as fund inflows, futures interest rise

Ripple is trading in a narrow range between $1.45 (immediate support) and $1.50 (resistance) at the time of writing on Monday. The remittance token extended its recovery last week, peaking at $1.67 on Sunday from the weekly open at $1.43.