XME Stock calling the rally and buying the dips at the blue box area

Hello fellow traders. In this technical blog we’re going to take a quick look at the Elliott Wave charts of XME ETF published in members area of the Elliottwave-Forecast . As our members know, XME is showing impulsive bullish sequences in the cycle from the 13.82 low. Consequently we recommended members to avoid selling it , while keep favoring the long side. Recently we got short term pull back that has unfolded as Elliott Wave ZIGZAG pattern that has given us opportunity to enter long trades. In further text we’re going to explain the forecast and Elliott Wave Pattern and trading strategy.
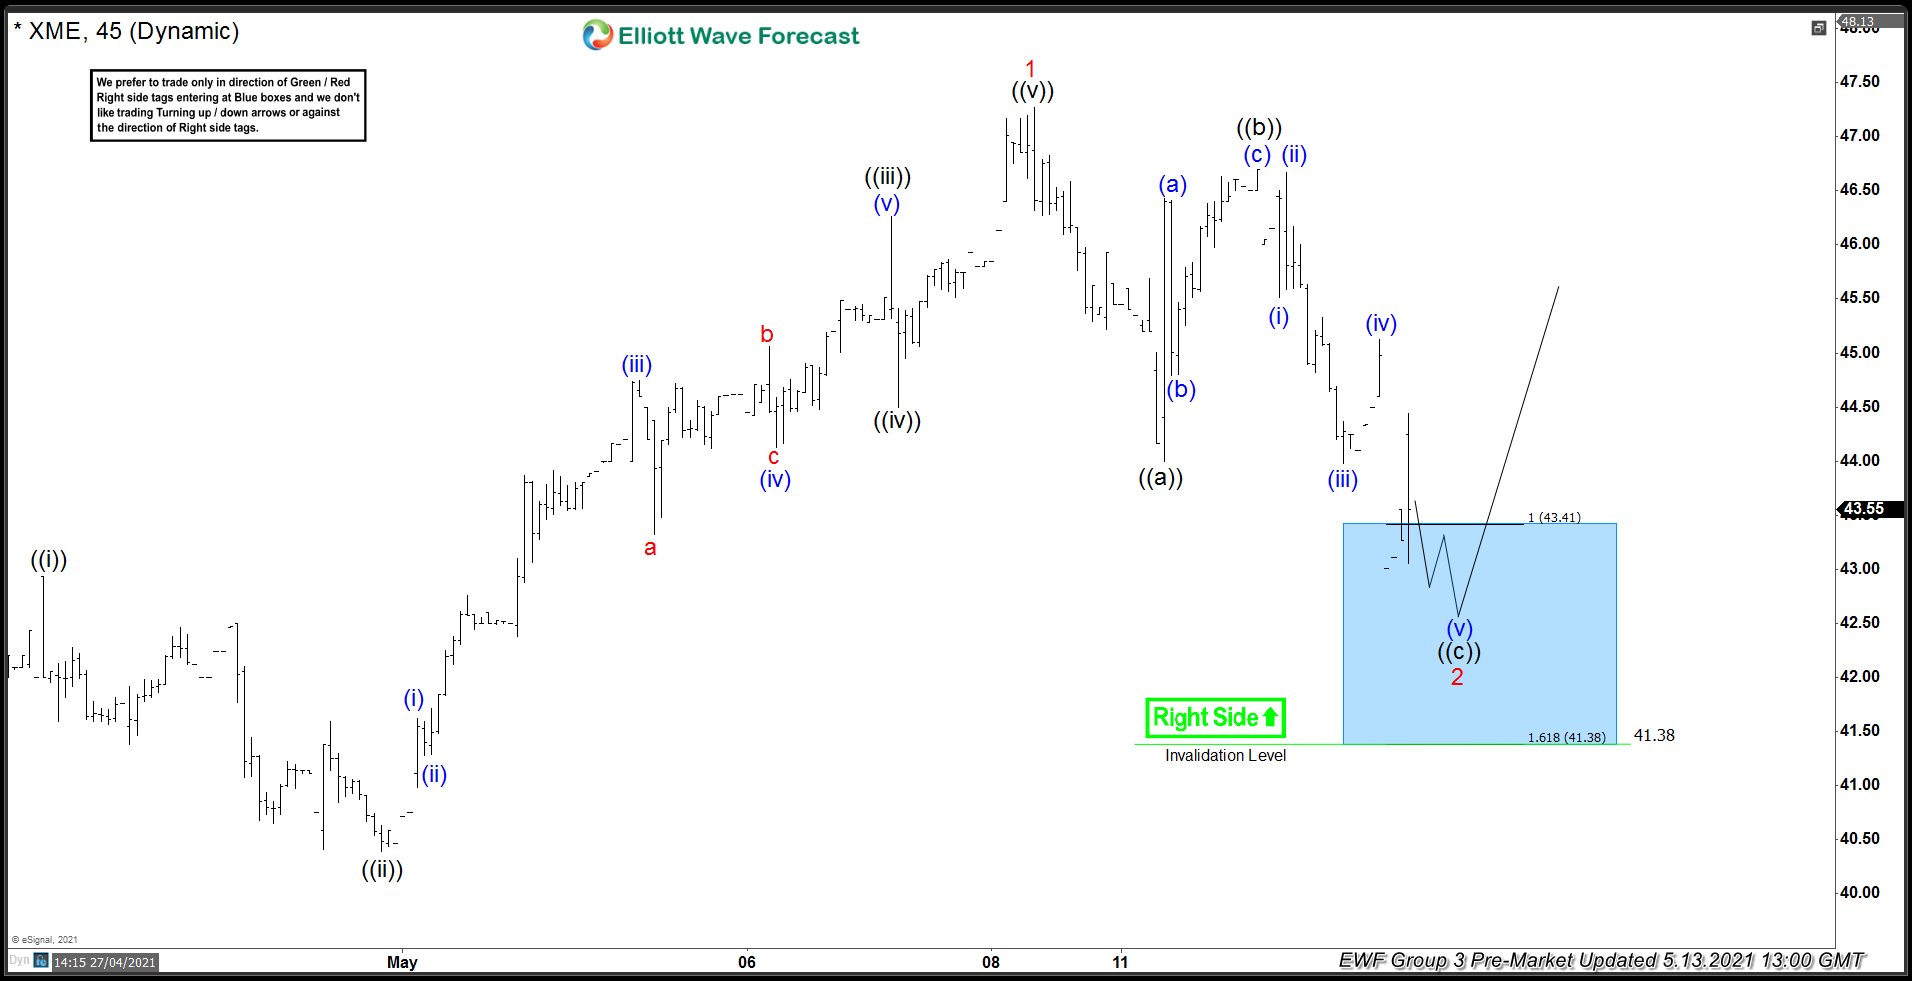
XME 1 hour Elliott Wave analysis 5.13.2021
Right side remains in the favor of the ETF. XME remains buy in a dips. Current view suggests 2 red pull back is unfolding as Elliott Wave Zig Zag pattern. Inner labeling of correction is : ((a))((b))((c)) black. The price has already reached extremes at 43.41 and showing enough number of swings. Pull back can complete any moment. We don’t recommend selling it and favor the long side from the marked blue box area: 43.41-43.38 . As the main trend is bullish we expect buyers to appear for 3 waves bounce at least. As our members know, Blue Boxes are no enemy areas , giving us 85% chance to get a bounce.
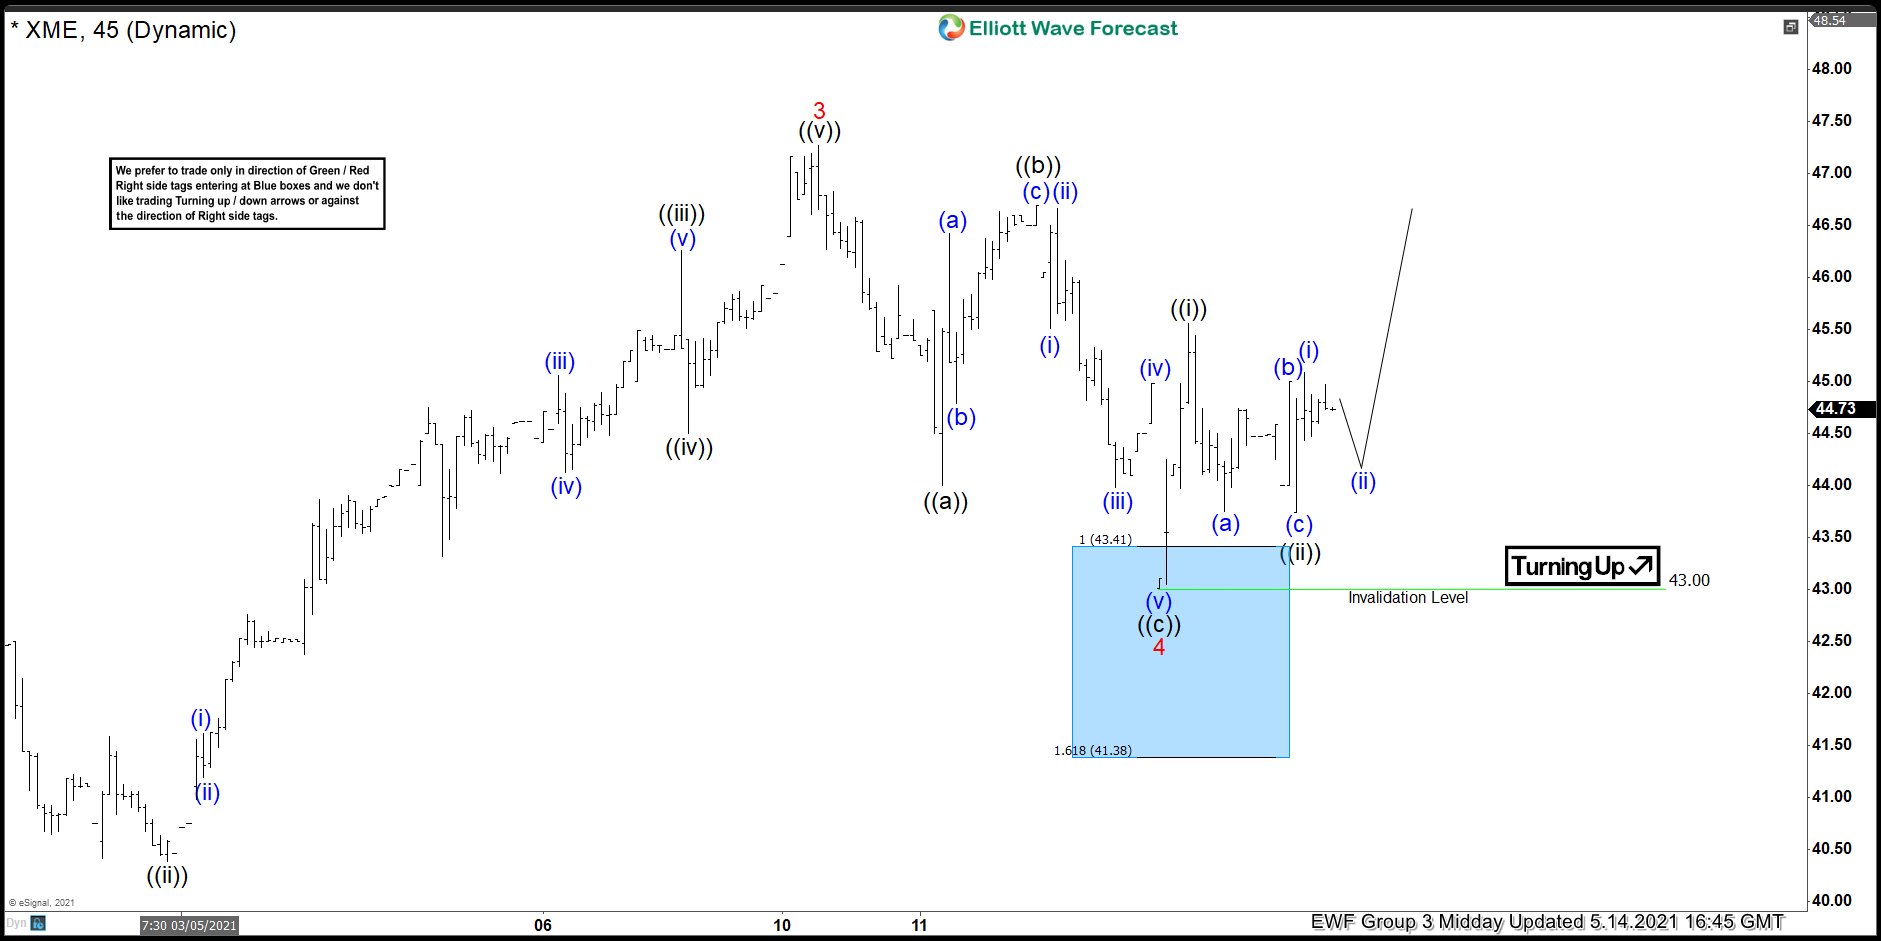
XME 1 hour Elliott Wave analysis 5.14.2021
XME found buyers at the blue box area. It made nice bounce from the buyers zone that has reached 50 fibs against the connector. All long positions from the blue box area should be risk free at this stage. Pull back completed at 43.00 low. As far as the price stays above that level, next leg up can be in progress. However, if 43.0 low gets broken, pull back will be still in progress as 7 swings structure, and we will measure new entry area.
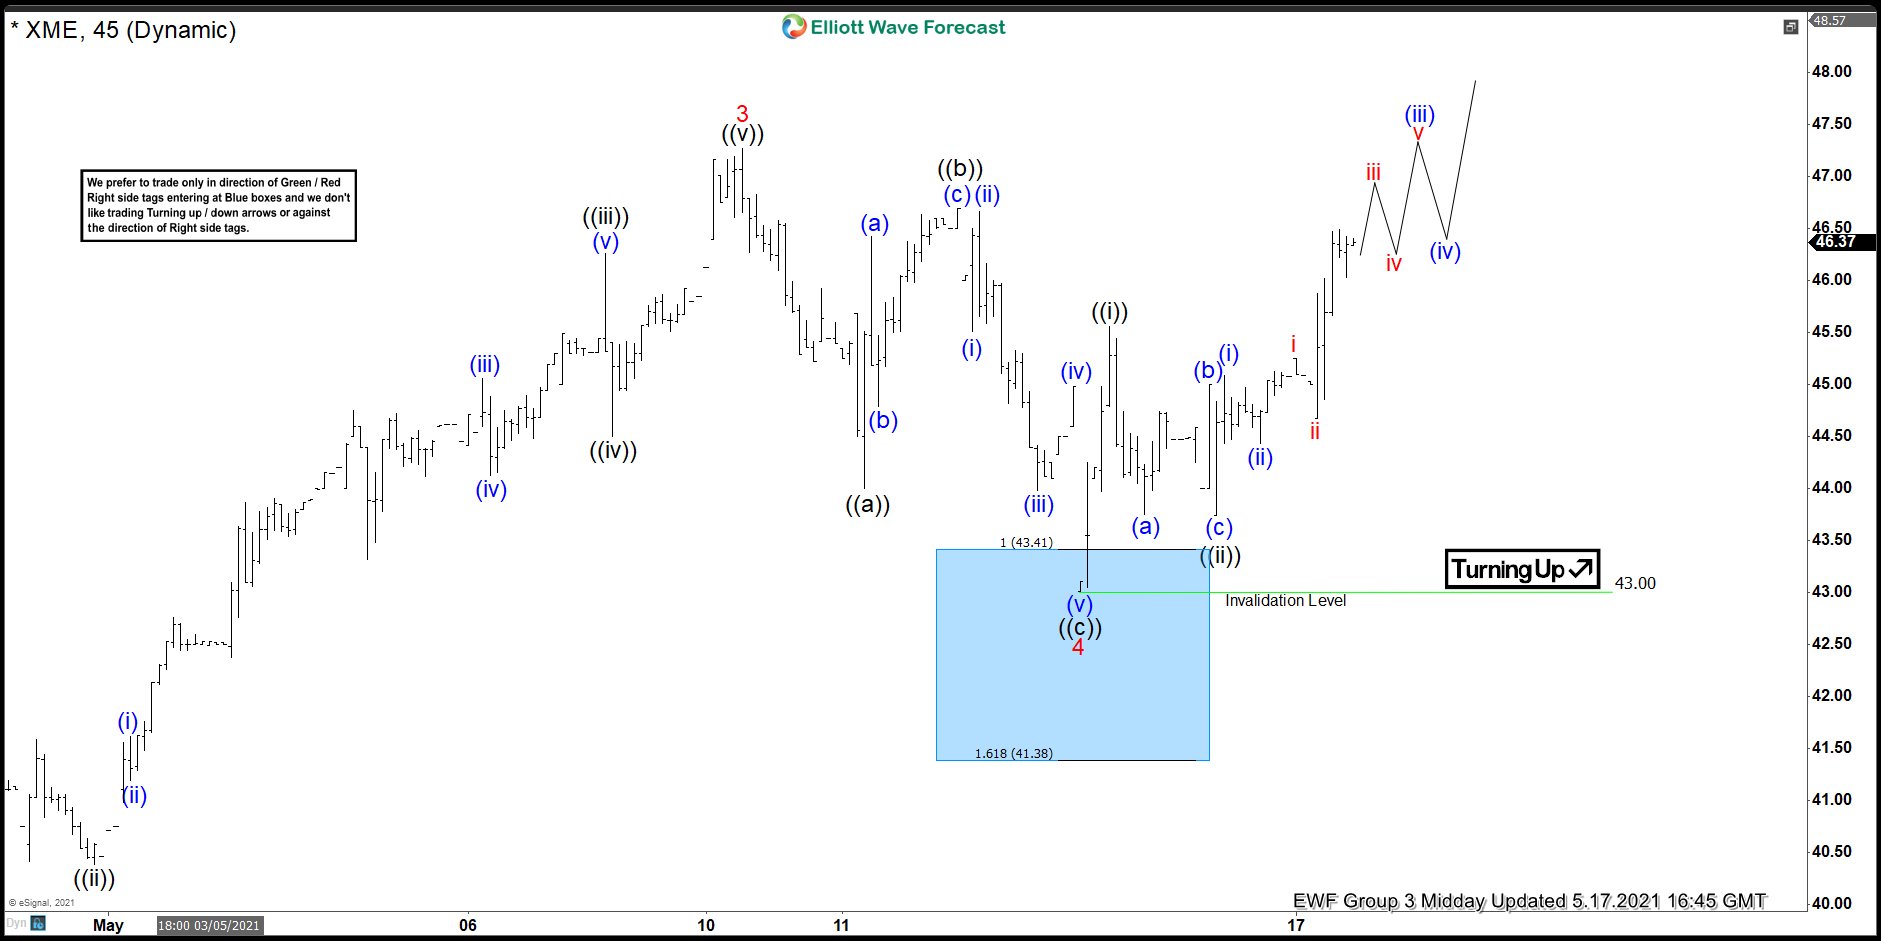
XME 1 hour Elliott Wave analysis 5.17.2021
43.0 low held well and we got further separation higher. We would like to see break above 3 red peak to confirm next leg up is in progress. Once we get that break, ETF will become bullish against the 43.00 low and it might be offering new buying opportunities for intraday traders. We don’t like selling it in any proposed pull back and favor staying long from the blue box area.
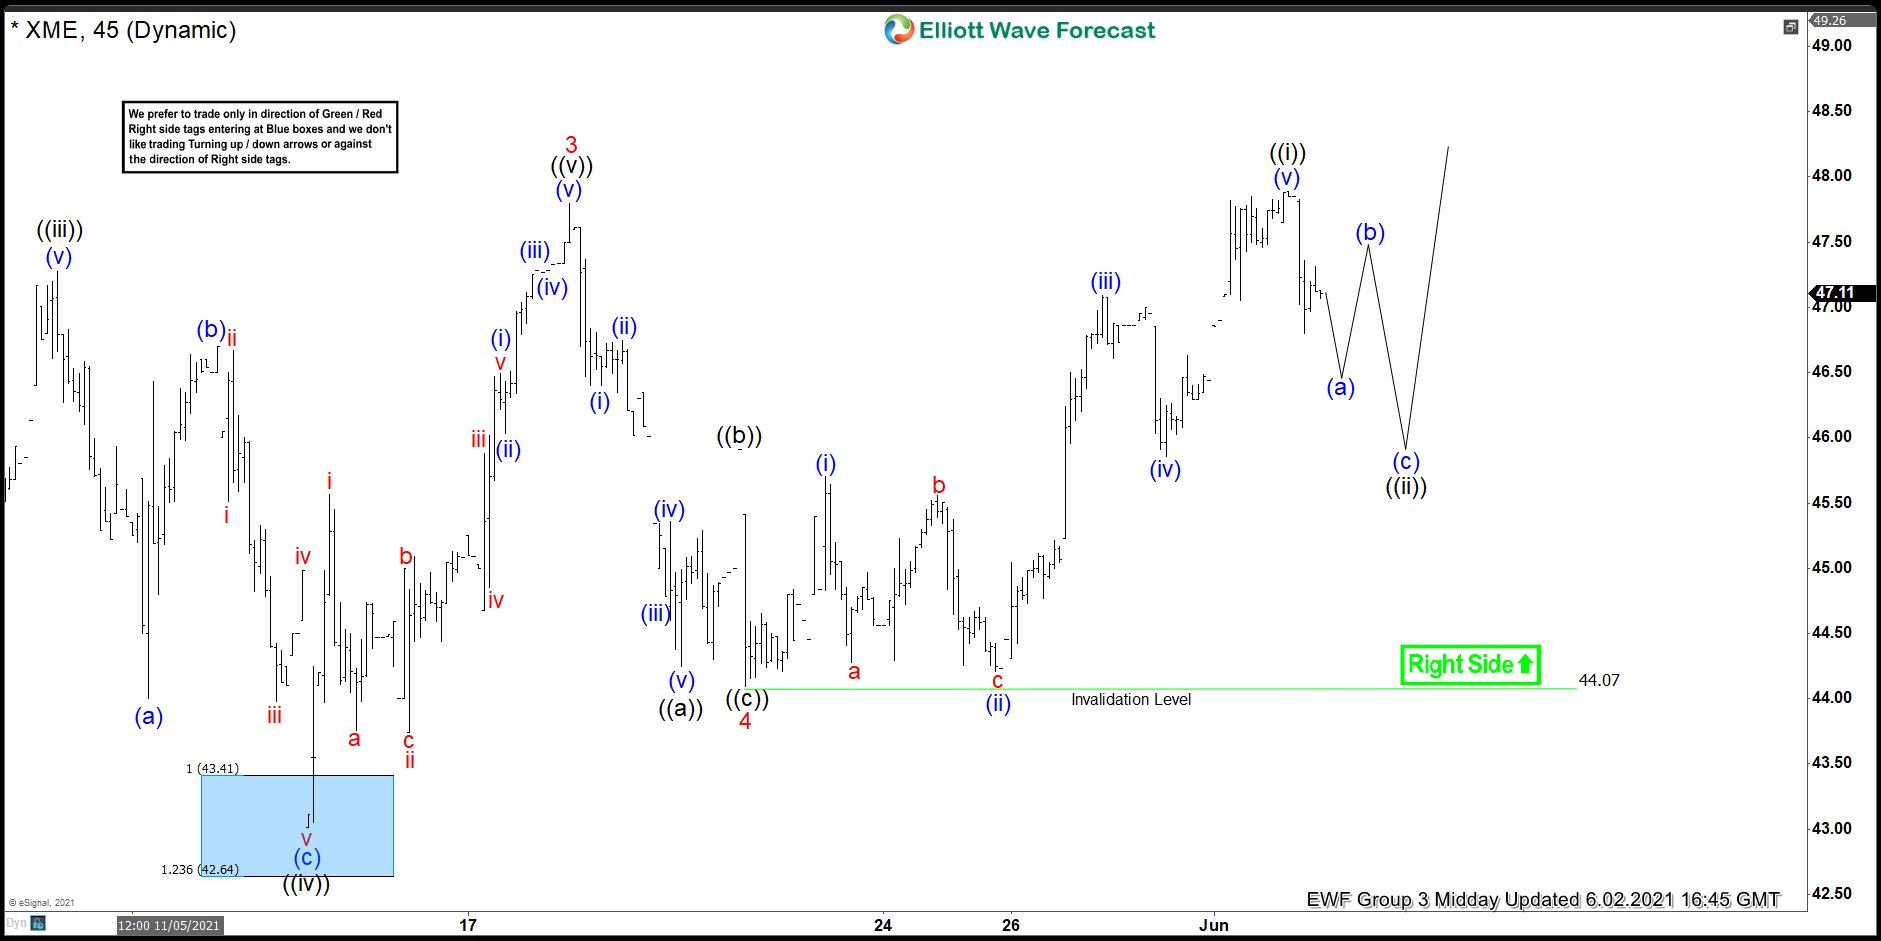
XME 1 hour Elliott Wave analysis 6.02.2021
Eventually XME broke toward new highs. With new price action, we adjusted count a little bit. Wave 4 red is now counted completed at the 44.07 low. ETF should ideally keep finding buyers against the 44.07 low. Keep in mind that market is dynamic and presented view could change in the mean time. Best instruments to trade are those having incomplete bullish or bearish swings sequences. We put them in Sequence Report and best among them are shown in the Live Trading Room. You can check most recent charts in the membership area of the site.
Premium
You have reached your limit of 3 free articles for this month.
Start your subscription and get access to all our original articles.
Author

Elliott Wave Forecast Team
ElliottWave-Forecast.com


