The financial sector has been testing all-time-highs

Wanted to drill down from the 30,000 foot view of “the stock market” and take a look at some sectors I like at the moment.
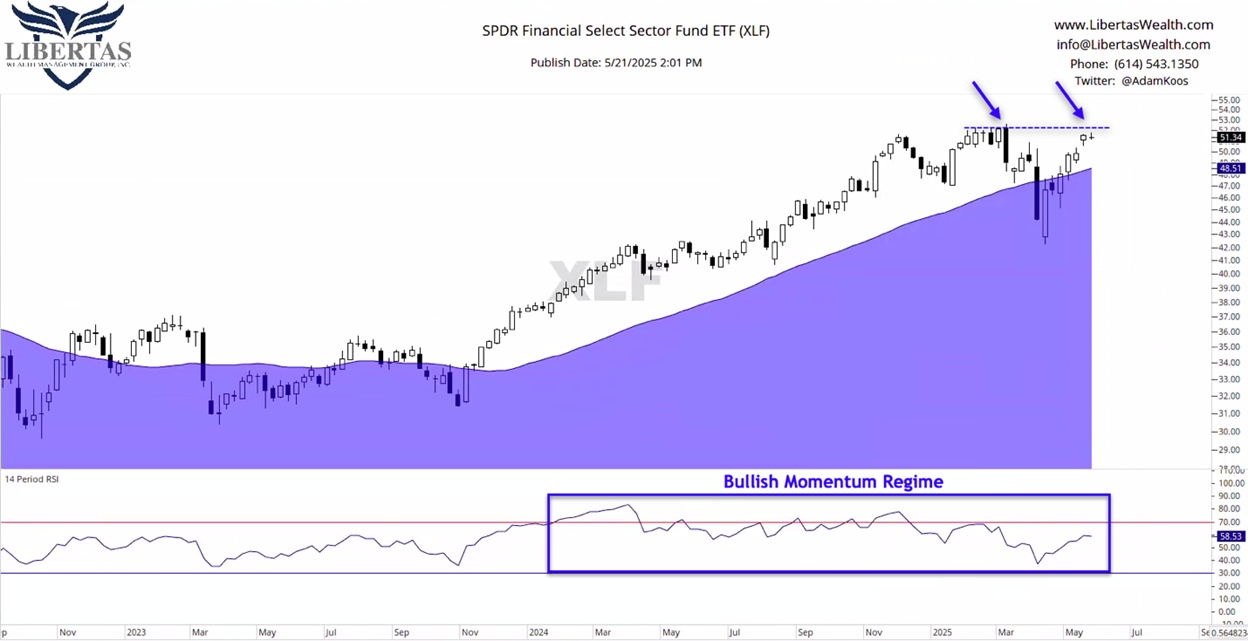
Let’s start with one of my recent favorites… the financial sector has been testing all-time-highs, trading above its rising 40-week moving average (40wMA).
The most recent high (this past week) is encroaching on the pre-Tariff Crash highs, and I think that, aside from the 40wMA being an important line-in-the-sand to hold, the January lows are a second, important level when it comes to risk-management.
However, the sector is recovering and remains in a bullish momentum regime (RSI in the lower pane remaining above 70) since early-2024, another piece of evidence for the bullish campers.
Disclosure: We own this investment in our clients’ portfolios at Libertas.
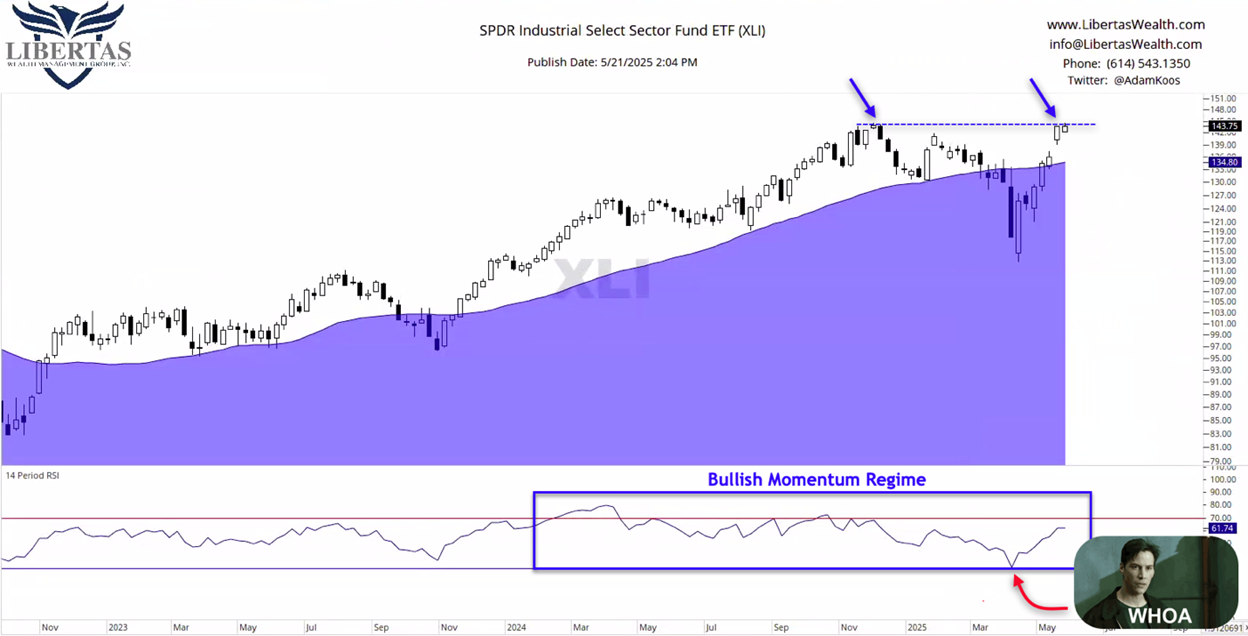
Another area of the market that has been exhibiting high relative strength for quite some time is the industrial sector.
And when I say “relative strength,” to those who are just getting started, think of all the investments in the world as all the teams in the NBA. If investments = “teams,” then, whenever we say we’re focused on those teams exhibiting the highest relative strength (or RS for short), we’re simply saying that we’re focusing on the playoff teams and avoiding the rest. Hope that makes sense.
Alright, analyzing the chart below, it looks a lot like financials (above) – contending with the November highs, trading above its 40wMA, and while it’s spent most of its time since early-2024 in a bullish momentum regime, Neo points out that, if you squint really hard, you’ll see that RSI did fall just a fraction-of-a-point below 30 during the Tariff crash.
That being said, one could argue that it “doesn’t count” because it wasn’t a decisive break…but it’s worth noting that it DID break below that bearish line-in-the-sand… technically speaking. J
Disclosure: We own this investment in our clients’ portfolios at Libertas.
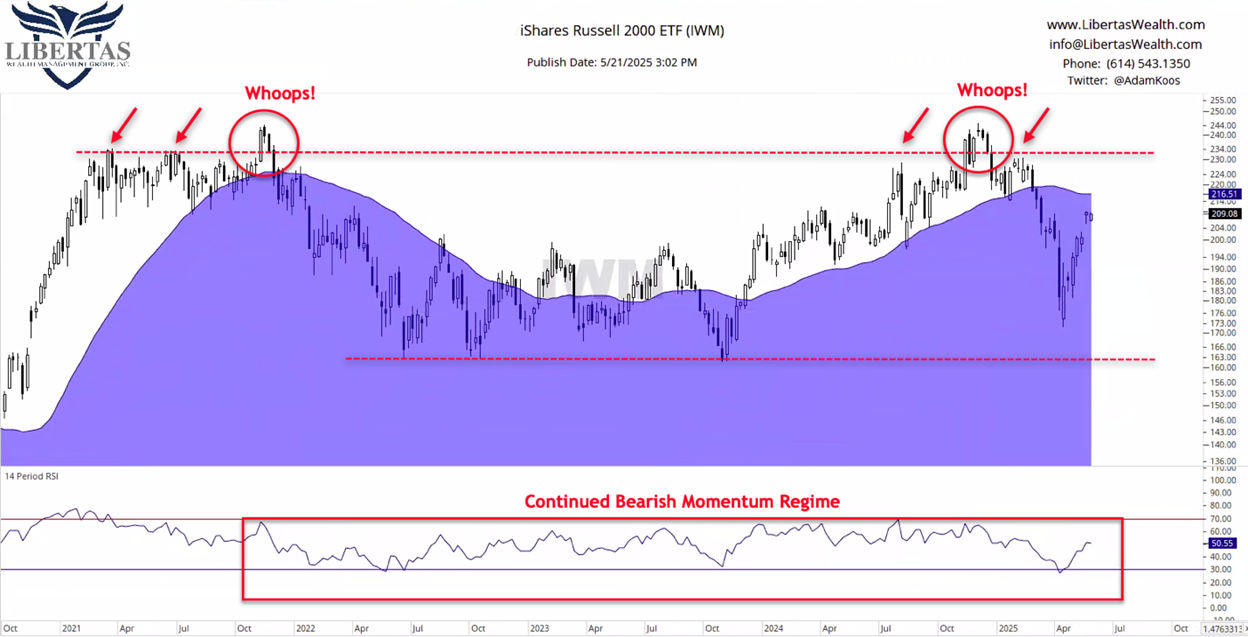
The last chart I thought I’d share is one we don’t own in our model portfolios, but one that we’ve owned a couple of times in 2024, and one that I continue to watch closely as the markets battle it out.
Below is the small cap index – essentially a basket of small company stocks – and as you can clearly see, both attempt at all-time-highs were short-lived (only a handful of weeks) before the break-out fizzled-out… a picture that is very different from the S&P500, Dow Jones Industrial Average, and the NASDAQ Composite.
Small caps have remained in a bearish momentum regime throughout the 2022 bear market, and they’ve been unable to prove themselves, even as major market indices turned the corner and bulls took over this past 2 ½ years.
There’s a floor of potential support at the 2022-23 lows… and then of course, the ceiling of potential overhead resistance at the many highs printed in 2021 and 2024 (not to mention, the bull-traps / false breakouts mentioned earlier).
Still, as Ralph Acampora has said many times before “Rotation is the lifeblood of a bull market,” and the more time that passes, the higher the probability that small caps will have their day in the spotlight… and I think it was Louise Yamada who coined the phrase “The bigger the base, the higher in space,” which simply means that, when this thing eventually does break out (or break down), we can expect it to come with positive (or negative) fanfare!
Unlock exclusive gold and silver trading signals and updates that most investors don’t see. Join our free newsletter now!
Unlock exclusive gold and silver trading signals and updates that most investors don’t see. Join our free newsletter now!
Author

CMT Association Research Team
CMT Association
The CMT Association is a global credentialing body that has served the financial industry for nearly 50 years.


