|

Xiaomi Corp (1810.HK) pulling back in wave (IV)

Xiaomi Corporation (1810.HK), founded in 2010 and headquartered in Beijing, China, is a leading global technology company known for its innovative smartphones, IoT devices, and lifestyle products. Listed on the Hong Kong Stock Exchange since July 2018, it operates through four main segments: Smartphones, IoT and Lifestyle Products, Internet Services, and Others, offering a wide range of products from smart TVs and laptops to electric vehicles. With a strong focus on affordable, high-quality tech and a growing presence in markets like Southeast Asia and India, Xiaomi has become the world’s third-largest smartphone vendor, boasting a market cap of approximately HKD 1.365 trillion as of early 2025. Below we will look at the Elliott Wave technical outlook of the company.

Xiaomi monthly Elliott Wave chart

Chart

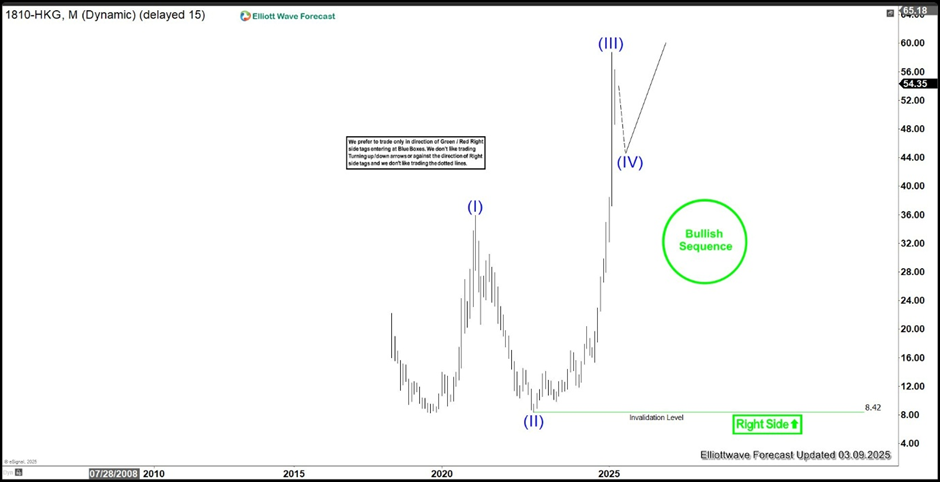
Monthly Elliott Wave Chart of Xiaomi above shows that rally from all-time low is unfolding as a 5 waves impulse. Wave (I) ended at 33.8 and pullback in wave (II) ended at 8.31. The stock rallied higher in wave (III) towards 58.7. Expect pullback in wave (IV) to correct cycle from 10.12.2022 low in 3, 7, or 11 swing before it resumes higher.

Xiaomi daily Elliott Wave chart

Chart

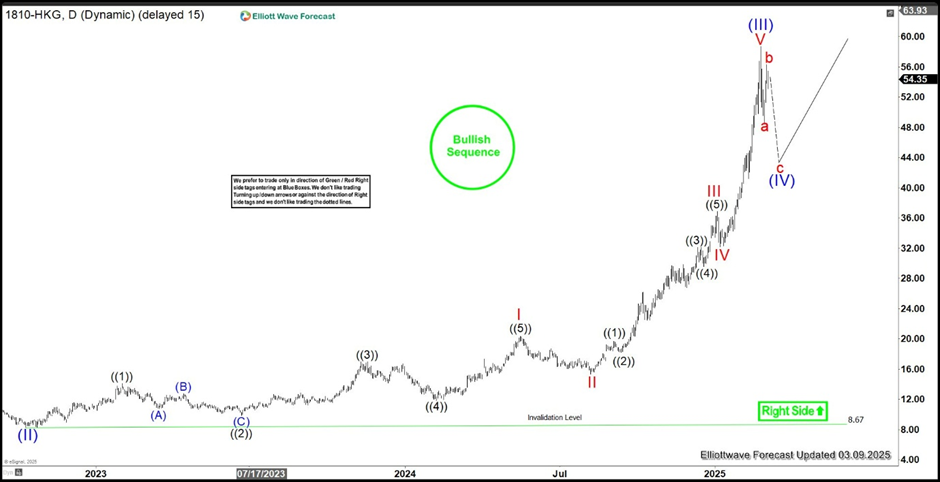
Daily Elliott Wave Chart of Xiaomi above shows that wave (II) ended at 8.67. The stock then nested higher from there. Wave I ended at 20.35 and wave II dips ended at 15.36. Stock then rallied higher in wave III towards 36.85 and pullback in wave IV ended at 32.2. Wave V ended at 58.7 which completed wave (III) in higher degree. Expect pullback in wave (IV) to correct cycle from 10.12.2022 low before it resumes higher again. While pivot at 8.67 low remains intact, expect pullback to find support in 3, 7, or 11 swing for further upside.

Author

Elliott Wave Forecast Team

Elliott Wave Forecast Team

ElliottWave-Forecast.com

More from Elliott Wave Forecast Team
Share:

Editor's Picks

EUR/USD stays defensive below 1.1900 as USD recovers

EUR/USD trades in negative territory for the third consecutive day, below 1.1900 in the European session on Thursday. A modest rebound in the US Dollar is weighing on the pair, despite an upbeat market mood. Traders keep an eye on the US weekly Initial Jobless Claims data for further trading impetus. 

GBP/USD holds above 1.3600 after UK data dump

\GBP/USD moves little while holding above 1.3600 in the European session on Thursday, following the release of the UK Q4 preliminary GDP, which showed a 0.1% growth against a 0.2% increase expected. The UK industrial sector activity deteriorated in Decembert, keeping the downward pressure intact on the Pound Sterling. 

Gold sticks to modest intraday losses as reduced March Fed rate cut bets underpin USD

Gold languishes near the lower end of its daily range heading into the European session on Thursday. The precious metal, however, lacks follow-through selling amid mixed cues and currently trades above the $5,050 level, well within striking distance of a nearly two-week low touched the previous day.

Cardano eyes short-term rebound as derivatives sentiment improves

Cardano (ADA) is trading at $0.257 at the time of writing on Thursday, after slipping more than 4% so far this week. Derivatives sentiment improves as ADA’s funding rates turn positive alongside rising long bets among traders.

A tale of two labour markets: Headline strength masks underlying weakness

Undoubtedly, yesterday’s delayed US January jobs report delivered a strong headline – one that surpassed most estimates. However, optimism quickly faded amid sobering benchmark revisions.

Sonic Labs’ vertical integration fuels recovery in S token

Sonic, previously Fantom (FTM), is extending its recovery trade at $0.048 at the time of writing, after rebounding by over 12% the previous day. The recovery thesis’ strengths lie in the optimism surrounding Sonic Labs’ Wednesday announcement to shift to a vertically integrated model, aimed at boosting S token utility.