Xero Limited Elliott Wave technical forecast [Video]
![Xero Limited Elliott Wave technical forecast [Video]](https://editorial.fxstreet.com/images/TechnicalAnalysis/ChartPatterns/Candlesticks/close-up-of-candlestick-stock-chart-with-pen-40815814.jpg)
ASX: XRO Elliott Wave technical analysis
Greetings, Our Elliott Wave analysis today updates the Australian Stock Exchange (ASX) with XERO LIMITED - XRO. We see ASX:XRO continuing to move a little higher with an unfolding Diagonal.
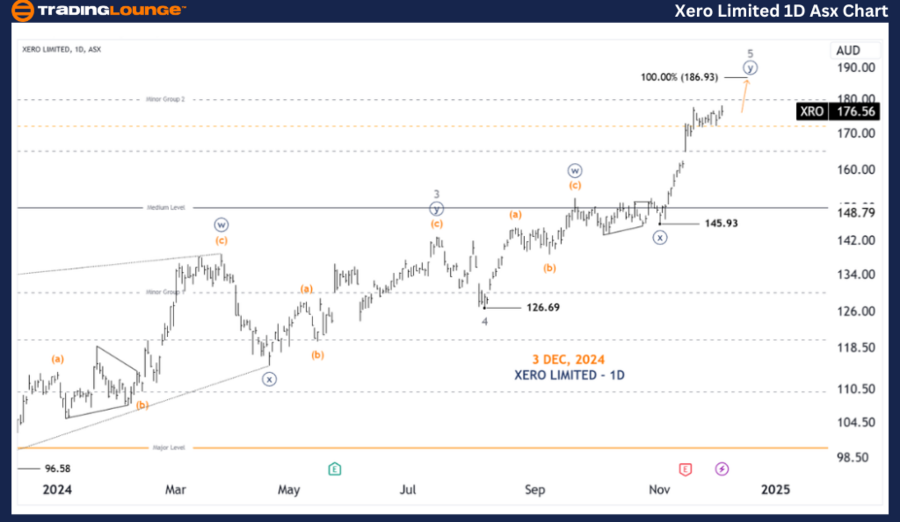
ASX: XRO one-day chart (semilog scale) analysis
Function: Major trend (Minor degree, gray).
Mode: Motive.
Structure: Diagonal.
Position: Wave ((y))-navy of Wave 5-grey.
Details: We are inside the 5-grey wave, more specifically it is a part of the whole Diagonal labeled from 1-grey to 5-grey. So its subwaves are 3-3-3-3-3. The 5-grey wave will probably continue to move a little higher, aiming at a target around 186.93 as a double zigzag labeled ((w))((x))((y))-navy.
Invalidation point: 145.93.
ASX: XRO Four-hour chart analysis
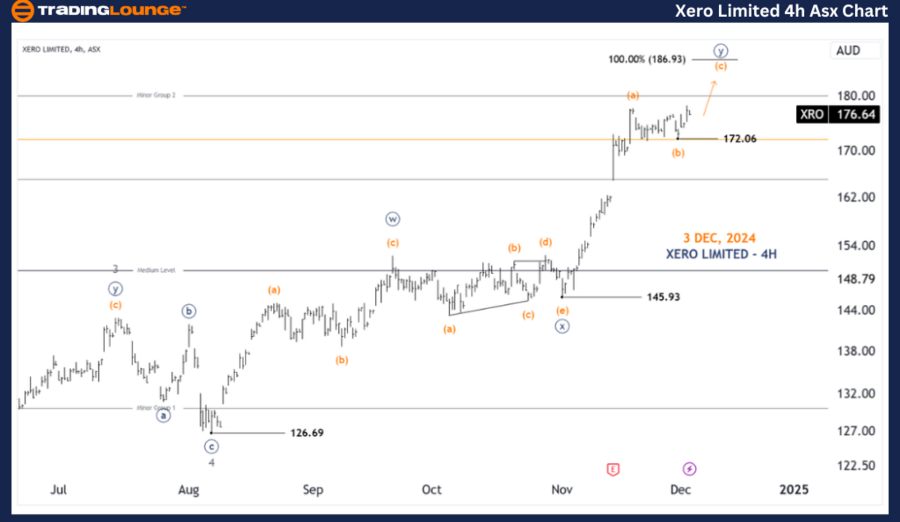
Function: Major trend (Minute degree, navy).
Mode: Motive.
Structure: Diagonal.
Position: Wave (c)-orange of Wave ((y)).
Details: Taking a closer look at the 5-grey wave, it is developing as a Double Zigzag labeled ((w))((x))((y)-navy, we are inside the ((y))-navy wave. It is itself a Zigzag labeled (a)(b)(c)-orange, and the (c)-orange wave should probably continue to move up to around the 186.93 area. While price must remain below 172.06 to maintain this view. On the other hand, the 186.93 target is the limit for this entire Diagonal, pushing above it would mean we are entering a different wave count scenario instead of a Diagonal.
Invalidation point: 172.06.
Conclusion
Our analysis, forecast of contextual trends, and short-term outlook for ASX: XERO LIMITED - XRO aim to provide readers with insights into the current market trends and how to capitalize on them effectively. We offer specific price points that act as validation or invalidation signals for our wave count, enhancing the confidence in our perspective. By combining these factors, we strive to offer readers the most objective and professional perspective on market trends.
Xero Limited Elliott Wave technical forecast [Video]
Author

Peter Mathers
TradingLounge
Peter Mathers started actively trading in 1982. He began his career at Hoei and Shoin, a Japanese futures trading company.