|

WTI Technical Analysis: $54.15-20 becomes immediate obstacle towards $55.55

  • WTI trades around $54.10 during the early Asian trading on Thursday.
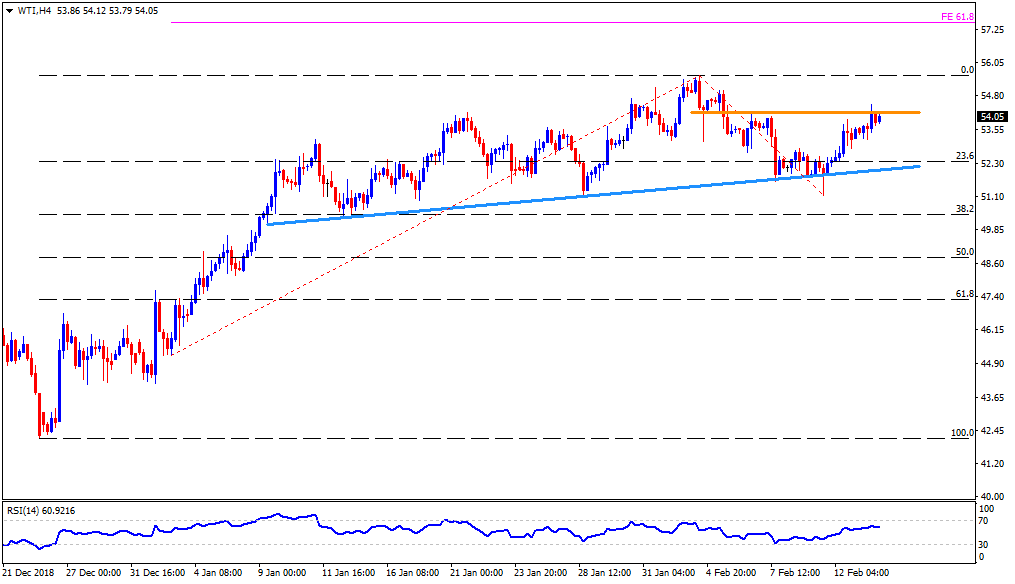
  • The commodity needs to surpass $54.15-20 horizontal-resistance in order to aim for an early-month high of $55.55. However, overbought levels of 14-bar relative strength index (RSI) may limit further upside.
  • In case buyers refrain to respect the $55.55 barrier, 61.8% Fibonacci expansion of its early January-February move, around $57.50, can flash on their radar to target.
  • Given the pair’s inability to rise past-$54.20, it can come back to $53.60 and $52.80 while an upward sloping trend-line connecting lows marked since January can hold further downside captive near $52.00.
  • If at all prices keep declining under $52.00, $51.10 and $50.30 may entertain sellers ahead of pleasing them with $50.00 round-figure.

WTI 4-Hour chart

WTI

Overview:
    Today Last Price: 54.61
    Today Daily change: 26 pips
    Today Daily change %: 0.48%
    Today Daily Open: 54.35
Trends:
    Daily SMA20: 53.63
    Daily SMA50: 51.08
    Daily SMA100: 56.25
    Daily SMA200: 62.96
Levels:
    Previous Daily High: 54.96
    Previous Daily Low: 53.64
    Previous Weekly High: 55.93
    Previous Weekly Low: 52.05
    Previous Monthly High: 55.48
    Previous Monthly Low: 44.52
    Daily Fibonacci 38.2%: 54.46
    Daily Fibonacci 61.8%: 54.14
    Daily Pivot Point S1: 53.67
    Daily Pivot Point S2: 53
    Daily Pivot Point S3: 52.35
    Daily Pivot Point R1: 54.99
    Daily Pivot Point R2: 55.64
    Daily Pivot Point R3: 56.31

Author

Anil Panchal

Anil Panchal

FXStreet

Anil Panchal has nearly 15 years of experience in tracking financial markets. With a keen interest in macroeconomics, Anil aptly tracks global news/updates and stays well-informed about the global financial moves and their implications.

More from Anil Panchal
Share:

Markets move fast. We move first.

Orange Juice Newsletter brings you expert driven insights - not headlines. Every day on your inbox.

By subscribing you agree to our Terms and conditions.

Editor's Picks

EUR/USD struggles for direction amid USD gains

EUR/USD is trimming part of its earlier gains, coming under some mild downside pressure near 1.1730 as the US Dollar edges higher. Markets are still digesting the Fed’s latest rate decision, while also looking ahead to more commentary from Fed officials in the sessions ahead.

GBP/USD drops to daily lows near 1.3360

Disappointing UK data weighed on the Sterling towards the end of the week, triggering a pullback in GBP/USD to fresh daily lows near 1.3360. Looking ahead, the next key event across the Channel is the BoE meeting on December 18.

Gold losses momentum, challenges $4,300

Gold now gives away some gains and disputes the key $4,300 zone per troy ounce following earlier multi-week highs. The move is being driven by expectations that the Fed will deliver further rate cuts next year, with the yellow metal climbing despite a firmer Greenback and rising US Treasury yields across the board.

Litecoin Price Forecast: LTC struggles to extend gains, bullish bets at risk

Litecoin (LTC) price steadies above $80 at press time on Friday, following a reversal from the $87 resistance level on Wednesday. Derivatives data suggests a bullish positional buildup while the LTC futures Open Interest declines, flashing a long squeeze risk.

Big week ends with big doubts

The S&P 500 continued to push higher yesterday as the US 2-year yield wavered around the 3.50% mark following a Federal Reserve (Fed) rate cut earlier this week that was ultimately perceived as not that hawkish after all. The cut is especially boosting the non-tech pockets of the market.

Aave Price Forecast: AAVE primed for breakout as bullish signals strengthen

Aave (AAVE) price is trading above $204 at the time of writing on Friday and approaching the upper boundary of its descending parallel channel; a breakout from this structure would favor the bulls.