WTI Technical Analysis: $51.65 gains market attention
- WTI remains around $52.50 before Asian market open on Monday.
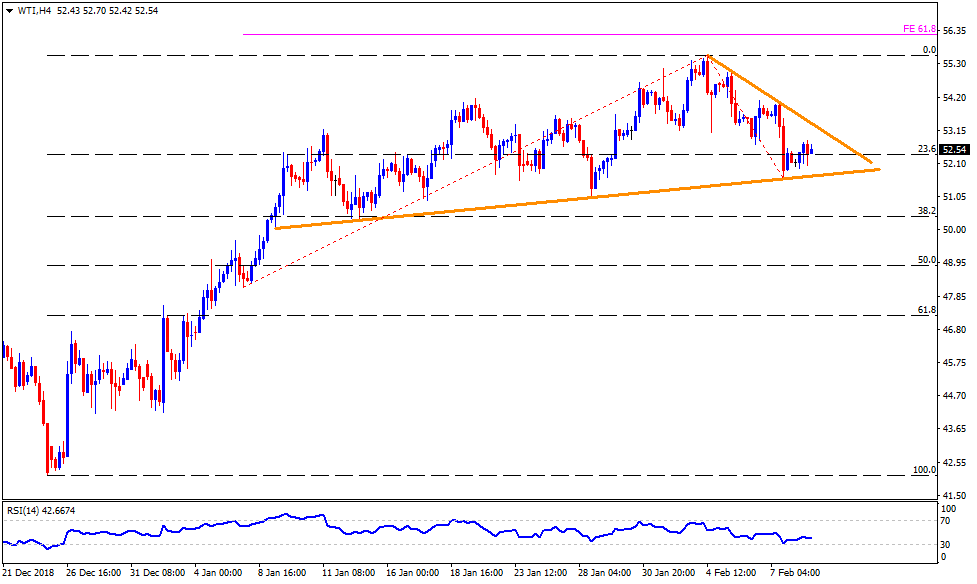
- The prices continue respecting a month-old upward sloping trend-line, currently at $51.65.
- With the recent lower highs during the last-week the quote may drop to $50.60 and $50.30 on the break of $51.65 support-line. Though, $50.00 might challenge the sellers.
- In case bears refrain to respect the $50.00 round-figure, the $49.10-$49.00 support-zone should be important to watch.
- Alternatively, a descending resistance-line at $53.45 can continue limiting near-term upside of the WTI, breaking which $54.20 and the $55.00 may gain buyers’ attention.
- Should there be additional rise beyond $55.00, the $55.60 and the 61.8% Fibonacci expansion (FE) level of its recent up-moves may flash on Bulls’ radars.

WTI 4-Hourly charts
WTI
Overview:
Today Last Price: 52.85
Today Daily change: -15 pips
Today Daily change %: -0.28%
Today Daily Open: 53
Trends:
Daily SMA20: 53.39
Daily SMA50: 51.04
Daily SMA100: 56.87
Daily SMA200: 63.15
Levels:
Previous Daily High: 53.28
Previous Daily Low: 52.37
Previous Weekly High: 55.93
Previous Weekly Low: 52.05
Previous Monthly High: 55.48
Previous Monthly Low: 44.52
Daily Fibonacci 38.2%: 52.93
Daily Fibonacci 61.8%: 52.72
Daily Pivot Point S1: 52.49
Daily Pivot Point S2: 51.97
Daily Pivot Point S3: 51.58
Daily Pivot Point R1: 53.4
Daily Pivot Point R2: 53.79
Daily Pivot Point R3: 54.31
Author

Anil Panchal
FXStreet
Anil Panchal has nearly 15 years of experience in tracking financial markets. With a keen interest in macroeconomics, Anil aptly tracks global news/updates and stays well-informed about the global financial moves and their implications.


