WTI suffers an early fade within daily consolidation


  • Oil is sliding in early Asia as the Us dollar remains firmly toned. 
  • All eyes on US data for the day ahead in NFP.

WTI is trading a touch lower in Asia, down some 0.1% following slip from the 68.94 highs to a low of $68.80.

Oil prices were fairly tight on Thursday s the price travelled between $68.21 and a high of $69.37, up some 0.23% by the end of the North American day.

June, so far, has been a solid one for the prior of oil following two straight days of gains in the week.

Oil futures have rallied this week to highs not seen in a year after weekly US crude stocks fell sharply while fuel inventories rose more than expected.

''Optimism for a strong summer period for demand remains,'' analysts at ANZ Bank said.

''Data suggest it’s off to a good start, with the four week rolling average of gasoline supplied (a proxy for demand) gaining for the third straight week to 9.16mb/d. The same gauge for jet fuel has also recorded strong gains over the past few weeks.''

Brent futures settled at $71.31 a barrel, down 4 cents after touching its highest since May 2019 earlier in the session. US WTI crude settled at $68.81 a barrel, losing 2 cents.

WTI prices rose as high as $69.40, the strongest since October 2018, after gaining 1.5% in the previous session. US crude inventories fell by 5.1 million barrels last week.

This was by comparison to the expectations for a decrease of 2.4 million barrels. Gasoline stocks grew by 1.5 million barrels and distillate stockpiles jumped by 3.7 million barrels. 

Meanwhile, the greenback is making a comeback.

Stronger-than-expected US jobs data that suggested an improving labour market has reinforced signs that the world's largest economy is on the mend and will force the hand of the Fed. Thismakes today's Nonfarm Payroll a kye event for the day ahead. 

WTI technical analysis

Technically, the price of oil is moving higher but old daily resistance would now be expected to act as support where there is a confluence with the 10-day EMA.

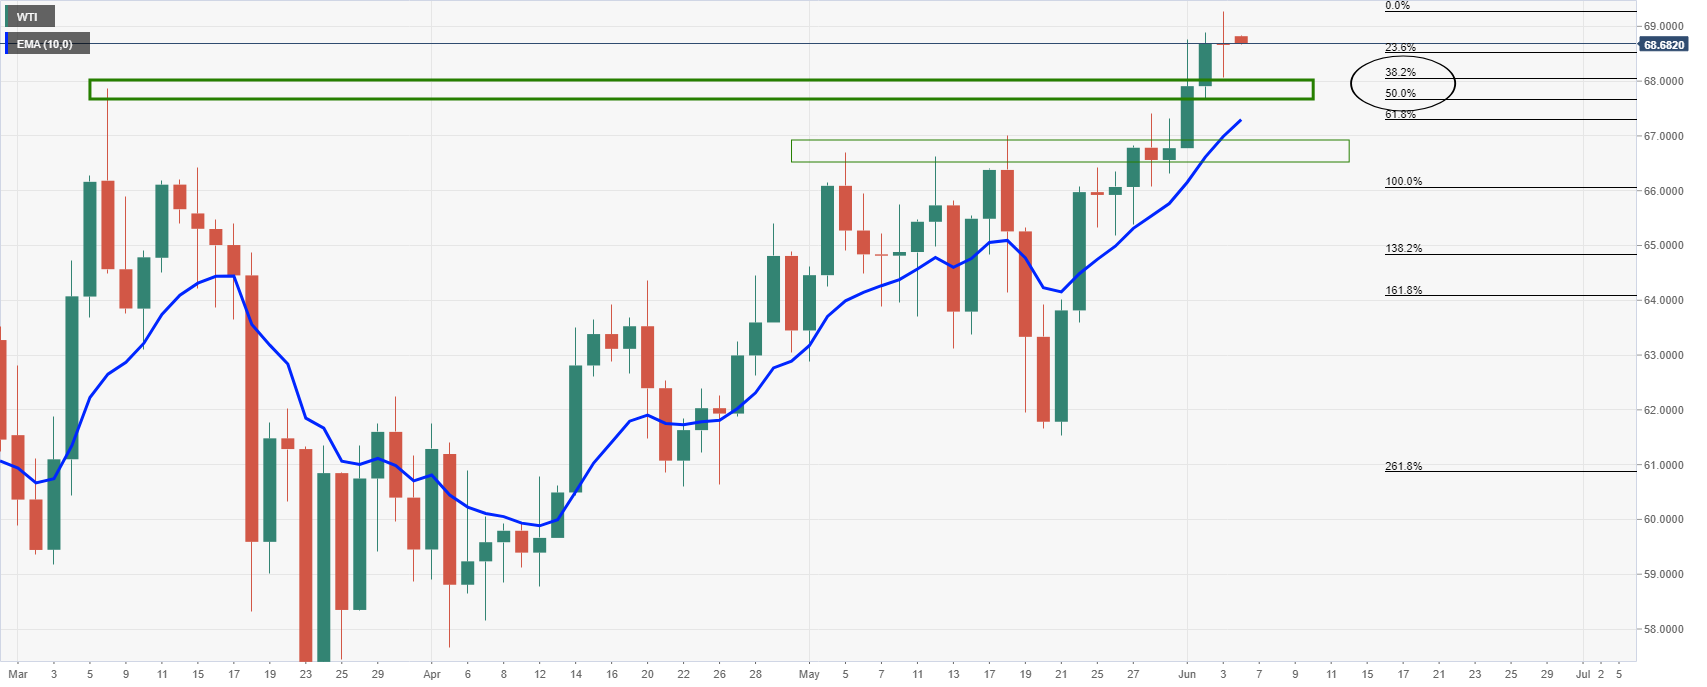
At this juncture, and according to the monthly chart, a correction might be on the cards before long.

The prior highs have a confluence with the 38.2% Fibonacci retracement level at 66.38 at this point. 
 

Share: Feed news

Information on these pages contains forward-looking statements that involve risks and uncertainties. Markets and instruments profiled on this page are for informational purposes only and should not in any way come across as a recommendation to buy or sell in these assets. You should do your own thorough research before making any investment decisions. FXStreet does not in any way guarantee that this information is free from mistakes, errors, or material misstatements. It also does not guarantee that this information is of a timely nature. Investing in Open Markets involves a great deal of risk, including the loss of all or a portion of your investment, as well as emotional distress. All risks, losses and costs associated with investing, including total loss of principal, are your responsibility. The views and opinions expressed in this article are those of the authors and do not necessarily reflect the official policy or position of FXStreet nor its advertisers. The author will not be held responsible for information that is found at the end of links posted on this page.

If not otherwise explicitly mentioned in the body of the article, at the time of writing, the author has no position in any stock mentioned in this article and no business relationship with any company mentioned. The author has not received compensation for writing this article, other than from FXStreet.

FXStreet and the author do not provide personalized recommendations. The author makes no representations as to the accuracy, completeness, or suitability of this information. FXStreet and the author will not be liable for any errors, omissions or any losses, injuries or damages arising from this information and its display or use. Errors and omissions excepted.

The author and FXStreet are not registered investment advisors and nothing in this article is intended to be investment advice.

Recommended content


Recommended content

Editors’ Picks

AUD/USD failed just ahead of the 200-day SMA

AUD/USD failed just ahead of the 200-day SMA

Finally, AUD/USD managed to break above the 0.6500 barrier on Wednesday, extending the weekly recovery, although its advance faltered just ahead of the 0.6530 region, where the key 200-day SMA sits.

AUD/USD News

EUR/USD met some decent resistance above 1.0700

EUR/USD met some decent resistance above 1.0700

EUR/USD remained unable to gather extra upside traction and surpass the 1.0700 hurdle in a convincing fashion on Wednesday, instead giving away part of the weekly gains against the backdrop of a decent bounce in the Dollar.

EUR/USD News

Gold keeps consolidating ahead of US first-tier figures

Gold keeps consolidating ahead of US first-tier figures

Gold finds it difficult to stage a rebound midweek following Monday's sharp decline but manages to hold above $2,300. The benchmark 10-year US Treasury bond yield stays in the green above 4.6% after US data, not allowing the pair to turn north.

Gold News

Bitcoin price could be primed for correction as bearish activity grows near $66K area

Bitcoin price could be primed for correction as bearish activity grows near $66K area

Bitcoin (BTC) price managed to maintain a northbound trajectory after the April 20 halving, despite bold assertions by analysts that the event would be a “sell the news” situation. However, after four days of strength, the tables could be turning as a dark cloud now hovers above BTC price.

Read more

Bank of Japan's predicament: The BOJ is trapped

Bank of Japan's predicament: The BOJ is trapped

In this special edition of TradeGATEHub Live Trading, we're joined by guest speaker Tavi @TaviCosta, who shares his insights on the Bank of Japan's current predicament, stating, 'The BOJ is Trapped.' 

Read more

Forex MAJORS

Cryptocurrencies

Signatures