WTI Price Forecast: WTI reclaims key moving averages as technical bias improves
- WTI trims intraday gains after hitting a six-month high near $66.24.
- Rising US-Iran tensions inject a fresh geopolitical risk premium into Oil markets.
- Technically, momentum indicators favor the upside, though near-overbought RSI warns of possible consolidation.

West Texas Intermediate (WTI) Crude Oil extends its advance on Thursday, briefly climbing to its highest level since August 4 as geopolitical risk premiums linked to rising US-Iran tensions underpin prices. At the time of writing, the US benchmark is trading around $65.20 a barrel, consolidating after touching an intraday high near $66.24.
Geopolitical tensions between the United States (US) and Iran have escalated after Washington issued fresh warnings of potential military action over Tehran’s nuclear programme, reviving concerns about possible supply disruptions across the Middle East.
Meanwhile, a broadly softer US Dollar (USD) is adding another layer of support, as a weaker Greenback makes dollar-denominated commodities cheaper for overseas buyers. However, persistent worries over global oversupply could act as a headwind, limiting the scope for further gains.
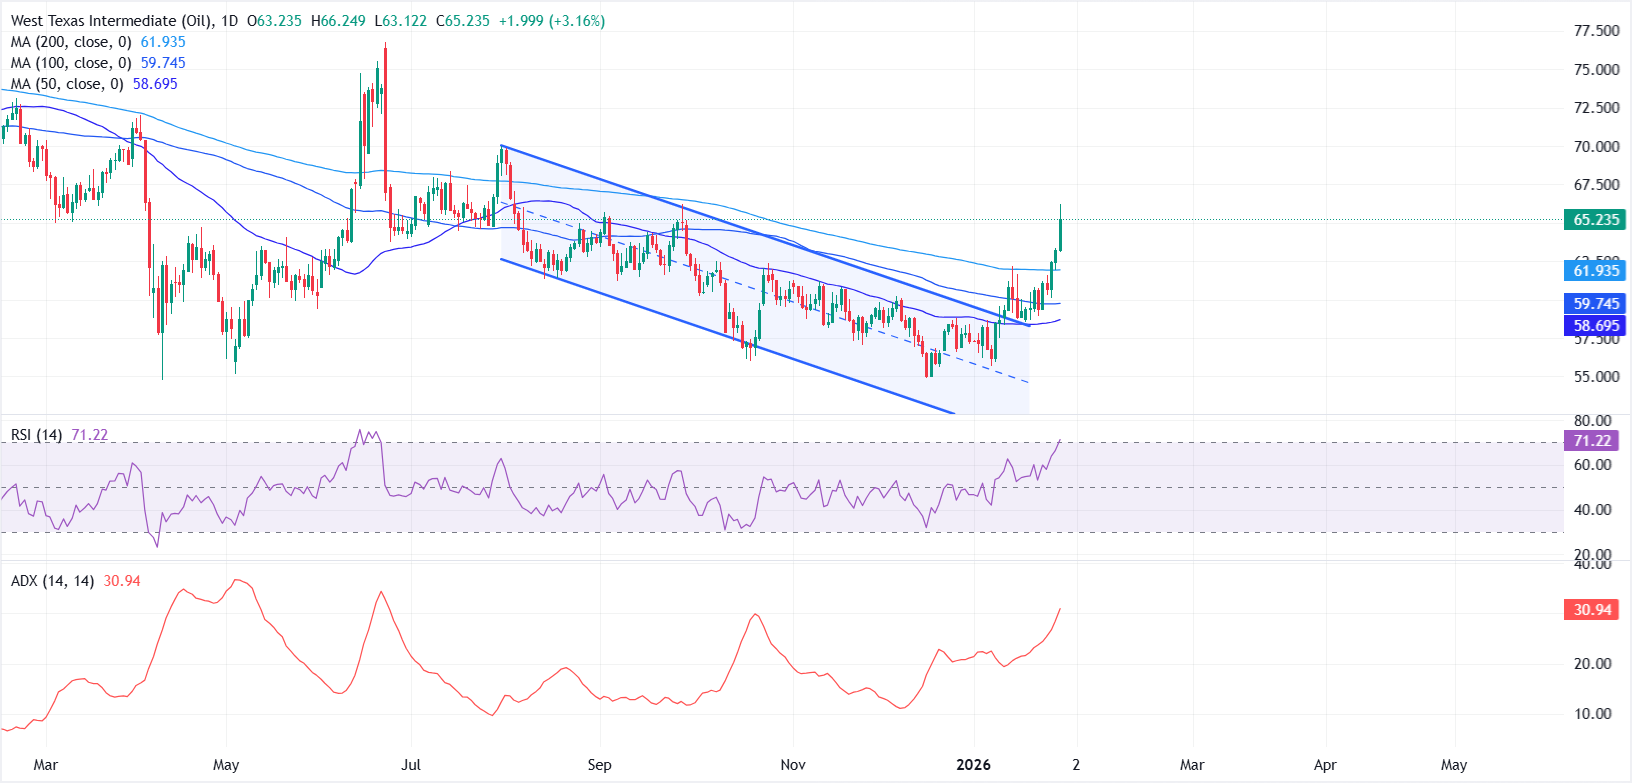
From a technical perspective, the daily chart has turned constructive, with WTI breaking decisively above a descending channel and reclaiming its key moving averages.
Price is now holding above the 50-day, 100-day, and 200-day Simple Moving Averages (SMAs). The 50-day SMA has turned higher, while the longer-term averages have begun to flatten after a prolonged decline, suggesting bearish momentum is fading and buyers are gradually regaining control.
Momentum indicators support this improving bias. The Relative Strength Index (RSI) is hovering near 70, pointing to strong upside momentum, though overbought conditions warn that the rally could pause or consolidate in the near term.
At the same time, the Average Directional Index (ADX) has climbed above 30, reinforcing the view that trend strength is increasing.
On the downside, the 200-day SMA near $61.90 acts as immediate dynamic support, ahead of the key psychological $60.00 level. Holding above this zone would keep the broader bullish setup intact.
On the upside, a sustained break above the $65.00 area would expose the next resistance near the August high around $67.00, with scope for a further extension toward the $70.00 handle if bullish momentum accelerates.
WTI Oil FAQs
WTI Oil is a type of Crude Oil sold on international markets. The WTI stands for West Texas Intermediate, one of three major types including Brent and Dubai Crude. WTI is also referred to as “light” and “sweet” because of its relatively low gravity and sulfur content respectively. It is considered a high quality Oil that is easily refined. It is sourced in the United States and distributed via the Cushing hub, which is considered “The Pipeline Crossroads of the World”. It is a benchmark for the Oil market and WTI price is frequently quoted in the media.
Like all assets, supply and demand are the key drivers of WTI Oil price. As such, global growth can be a driver of increased demand and vice versa for weak global growth. Political instability, wars, and sanctions can disrupt supply and impact prices. The decisions of OPEC, a group of major Oil-producing countries, is another key driver of price. The value of the US Dollar influences the price of WTI Crude Oil, since Oil is predominantly traded in US Dollars, thus a weaker US Dollar can make Oil more affordable and vice versa.
The weekly Oil inventory reports published by the American Petroleum Institute (API) and the Energy Information Agency (EIA) impact the price of WTI Oil. Changes in inventories reflect fluctuating supply and demand. If the data shows a drop in inventories it can indicate increased demand, pushing up Oil price. Higher inventories can reflect increased supply, pushing down prices. API’s report is published every Tuesday and EIA’s the day after. Their results are usually similar, falling within 1% of each other 75% of the time. The EIA data is considered more reliable, since it is a government agency.
OPEC (Organization of the Petroleum Exporting Countries) is a group of 12 Oil-producing nations who collectively decide production quotas for member countries at twice-yearly meetings. Their decisions often impact WTI Oil prices. When OPEC decides to lower quotas, it can tighten supply, pushing up Oil prices. When OPEC increases production, it has the opposite effect. OPEC+ refers to an expanded group that includes ten extra non-OPEC members, the most notable of which is Russia.
Author

Vishal Chaturvedi
FXStreet
I am a macro-focused research analyst with over four years of experience covering forex and commodities market. I enjoy breaking down complex economic trends and turning them into clear, actionable insights that help traders stay ahead of the curve.


