WTI Price Forecast: Oil consolidates between 21-day and 50-day SMAs
- WTI edges higher, trading near $64.00 after trimming intraday losses but struggling to extend gains.
- WTI is capped by key moving averages, with intraday action squeezed between the 21-day SMA and the 50-day SMA.
- Momentum indicators turn constructive, as RSI edges higher near 52 and MACD confirms a fresh bullish crossover.

West Texas Intermediate (WTI) Crude Oil edges higher during the American session on Wednesday after trimming intraday losses. At the time of writing, WTI is trading near the $64.00 mark, but the recovery lacks follow-through as the commodity struggles to extend gains for the fourth straight day.
The US Dollar (USD) is holding steady ahead of the Federal Reserve’s (Fed) monetary policy announcement, though it remains pinned close to its lowest level since July 1. The Fed’s decision on interest rates is expected to influence broader market sentiment, with a 25 bps cut largely priced in. For Oil traders, the tone of Fed Chair Powell’s guidance could dictate near-term price action.
Geopolitical tensions continue to underpin oil’s risk premium. Recent Ukrainian drone strikes on Russian Oil infrastructure have fueled concerns about potential supply disruptions. In Europe, Poland has called on the European Union (EU) to completely phase out Russian Oil imports by 2026, citing security risks, which could reshape medium-term supply flows.
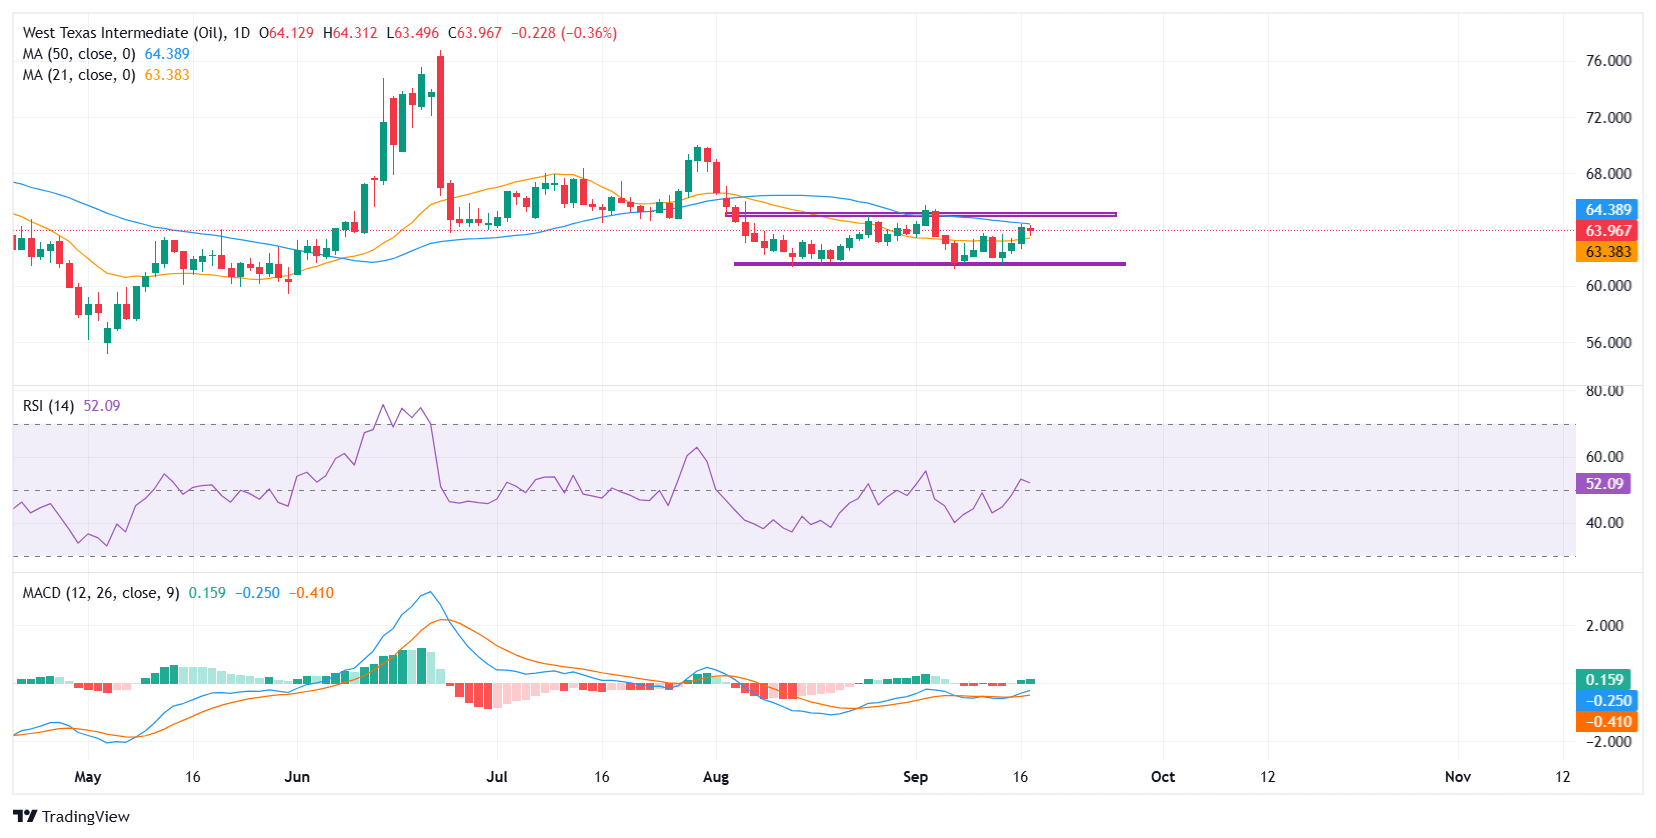
From a technical perspective, WTI is struggling to extend gains after Tuesday’s decisive break above the 21-day Simple Moving Average (SMA). While the short-term momentum improved with this breakout, the intraday price action is being squeezed between the 21-day SMA at $63.38 acting as immediate support and the 50-day SMA at $64.39 serving as resistance.
Zooming out, the broader structure remains defined by a horizontal range, with WTI contained between $65.00 on the upside and $61.50 on the downside since early August. A sustained break above the upper boundary could unlock room toward $67.00-68.00, whereas a drop below $61.50 would expose the $60.00 psychological level and potentially shift momentum back in favor of sellers.
Momentum indicators are beginning to tilt in favor of the bulls. The Relative Strength Index (RSI) holds around 52, signaling neutral conditions but edging higher. More notably, the Moving Average Convergence Divergence (MACD) is showing early signs of bullish momentum, with a fresh crossover confirmed as the MACD line moved above the signal line and the histogram flipped positive. This suggests upward pressure is building, though confirmation requires a clean break above the 50-day SMA to validate the signal.
WTI Oil FAQs
WTI Oil is a type of Crude Oil sold on international markets. The WTI stands for West Texas Intermediate, one of three major types including Brent and Dubai Crude. WTI is also referred to as “light” and “sweet” because of its relatively low gravity and sulfur content respectively. It is considered a high quality Oil that is easily refined. It is sourced in the United States and distributed via the Cushing hub, which is considered “The Pipeline Crossroads of the World”. It is a benchmark for the Oil market and WTI price is frequently quoted in the media.
Like all assets, supply and demand are the key drivers of WTI Oil price. As such, global growth can be a driver of increased demand and vice versa for weak global growth. Political instability, wars, and sanctions can disrupt supply and impact prices. The decisions of OPEC, a group of major Oil-producing countries, is another key driver of price. The value of the US Dollar influences the price of WTI Crude Oil, since Oil is predominantly traded in US Dollars, thus a weaker US Dollar can make Oil more affordable and vice versa.
The weekly Oil inventory reports published by the American Petroleum Institute (API) and the Energy Information Agency (EIA) impact the price of WTI Oil. Changes in inventories reflect fluctuating supply and demand. If the data shows a drop in inventories it can indicate increased demand, pushing up Oil price. Higher inventories can reflect increased supply, pushing down prices. API’s report is published every Tuesday and EIA’s the day after. Their results are usually similar, falling within 1% of each other 75% of the time. The EIA data is considered more reliable, since it is a government agency.
OPEC (Organization of the Petroleum Exporting Countries) is a group of 12 Oil-producing nations who collectively decide production quotas for member countries at twice-yearly meetings. Their decisions often impact WTI Oil prices. When OPEC decides to lower quotas, it can tighten supply, pushing up Oil prices. When OPEC increases production, it has the opposite effect. OPEC+ refers to an expanded group that includes ten extra non-OPEC members, the most notable of which is Russia.
Author

Vishal Chaturvedi
FXStreet
I am a macro-focused research analyst with over four years of experience covering forex and commodities market. I enjoy breaking down complex economic trends and turning them into clear, actionable insights that help traders stay ahead of the curve.


